GitLab CI jobs 173,099173,099
11/2/2020
11/4/2020
2
>=7.3.1
Prometheus
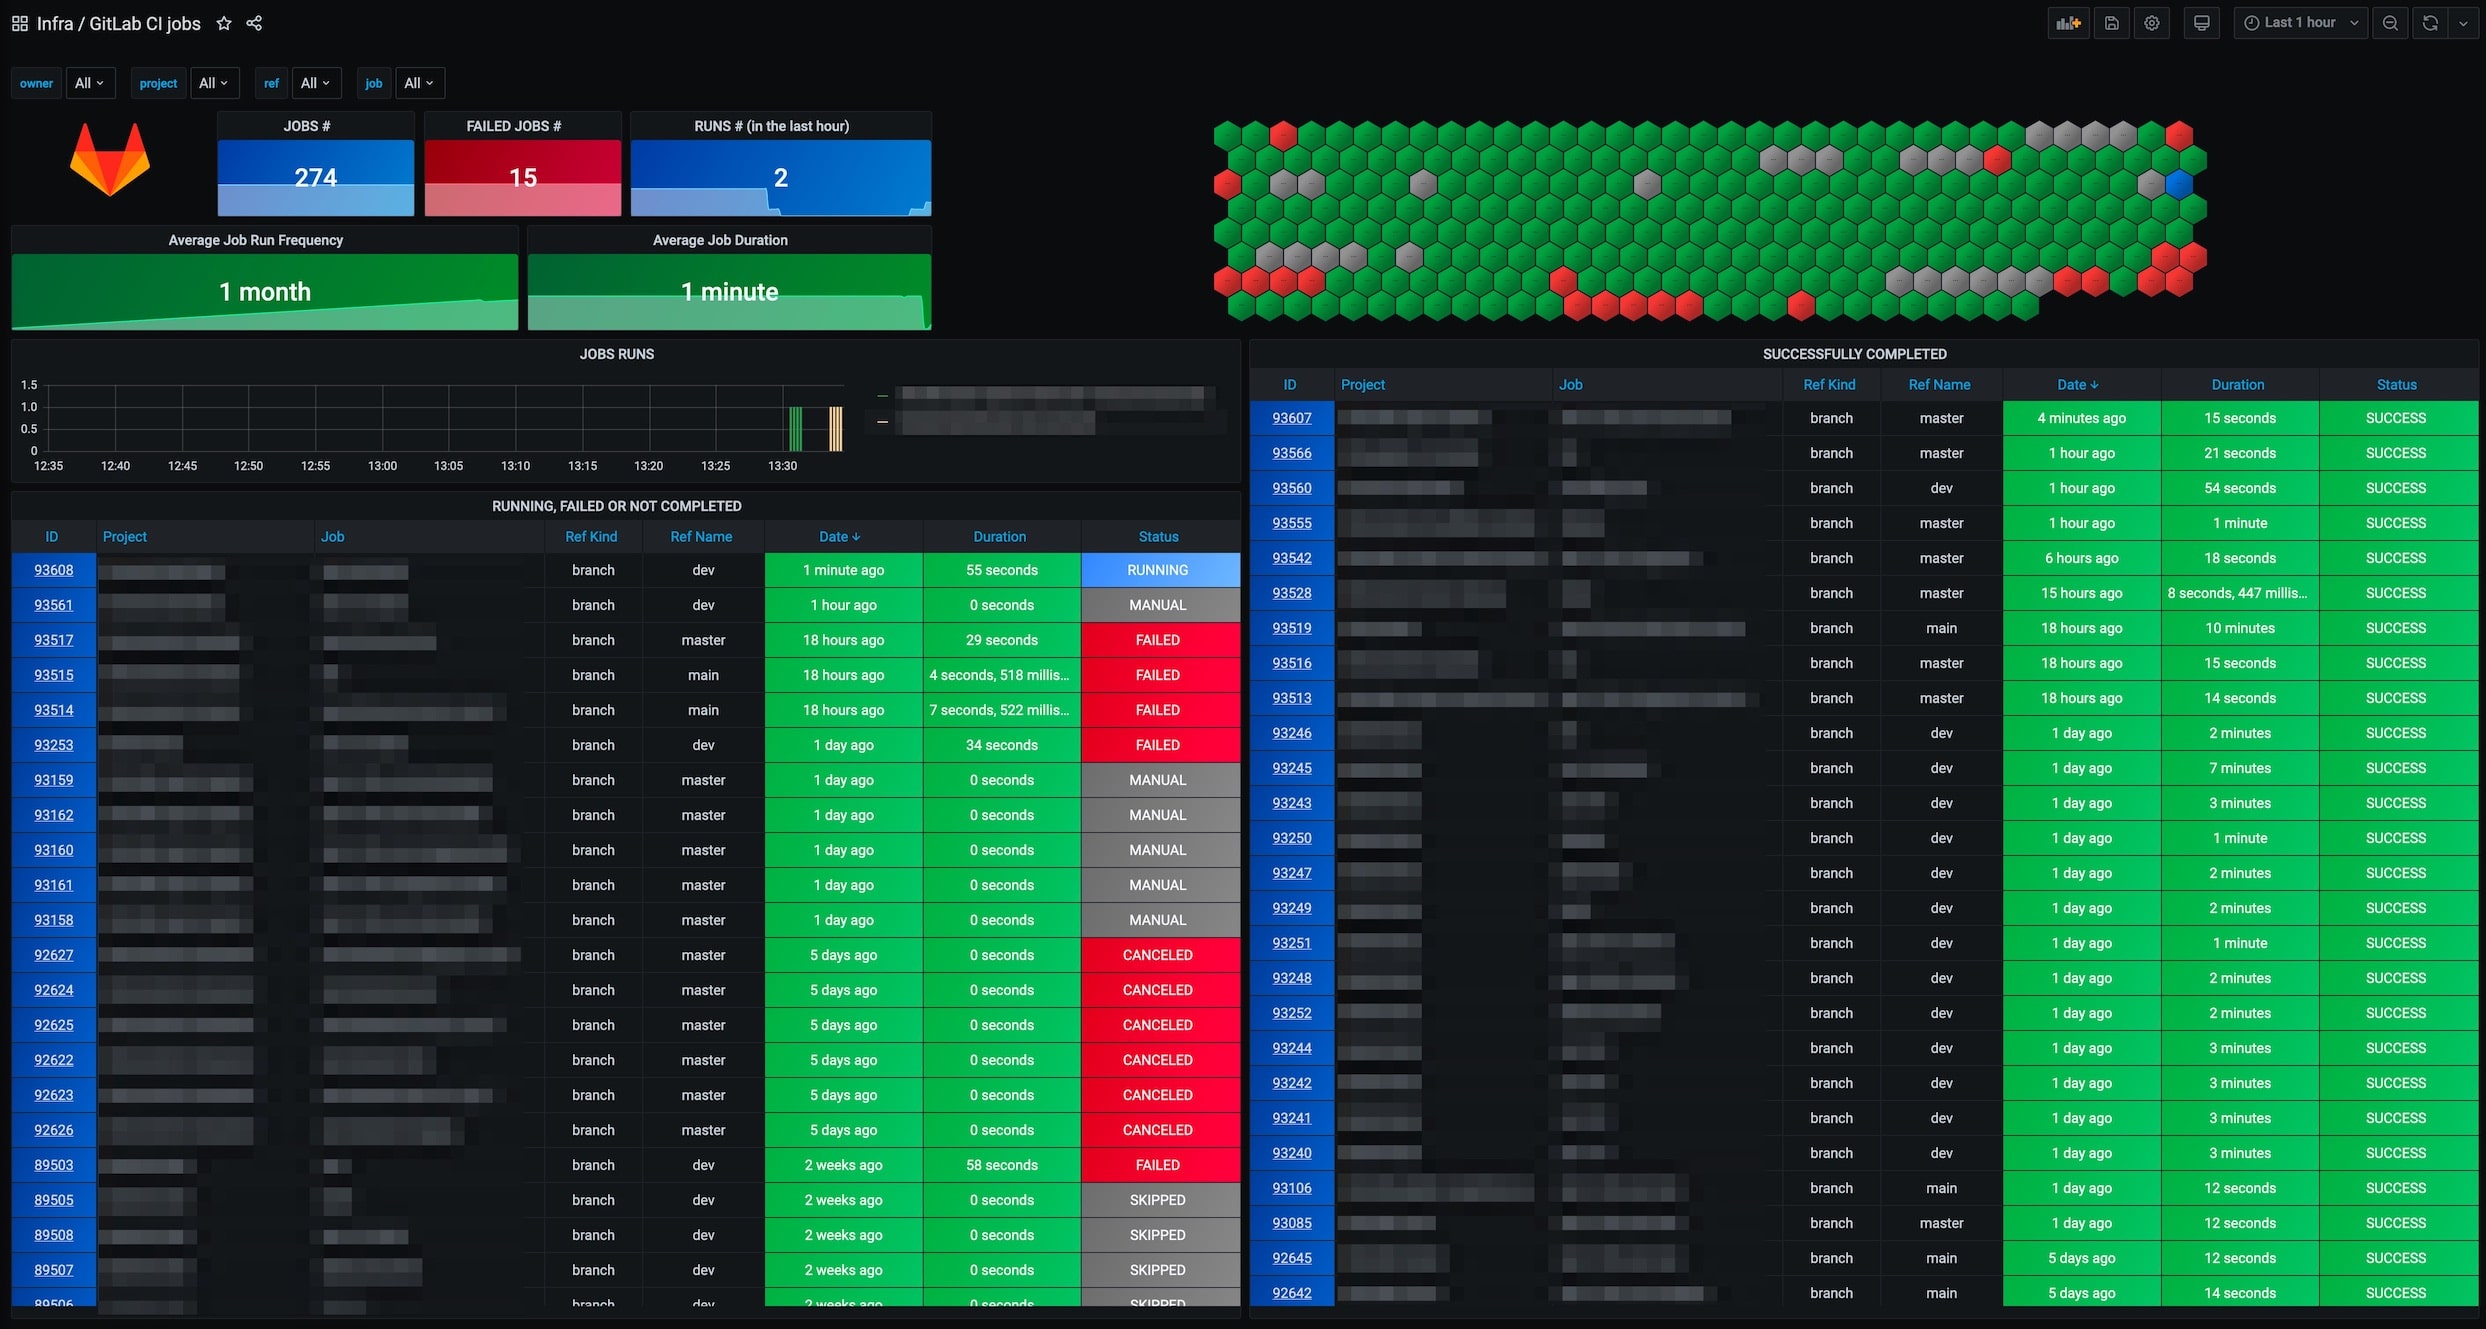
Description
This dashboard monitors GitLab CI pipeline job activity, focusing on job counts, success rates, and timing. It highlights gitlab_ci_pipeline_job_run_count, gitlab_ci_pipeline_job_status, and gitlab_ci_pipeline_job_duration_seconds to show total jobs, their current states (e.g., SUCCESSFULLY COMPLETED, RUNNING, or FAILED), and how long jobs take on average. It includes panels for recent runs (e.g., last hour), average run frequency, and duration analysis to quickly identify bottlenecks or failing trends.
Screenshots
Used Metrics 55
gitlab_ci_pipeline_job_duration_seconds
gitlab_ci_pipeline_job_id
gitlab_ci_pipeline_job_run_count
gitlab_ci_pipeline_job_status
gitlab_ci_pipeline_job_timestamp
Get Dashboard✕
Download
Copy to Clipboard