Geth Node Dashboard (Feb. 2022) 885885
2/14/2022
2/14/2022
1
>=8.3.6
Prometheus
Description
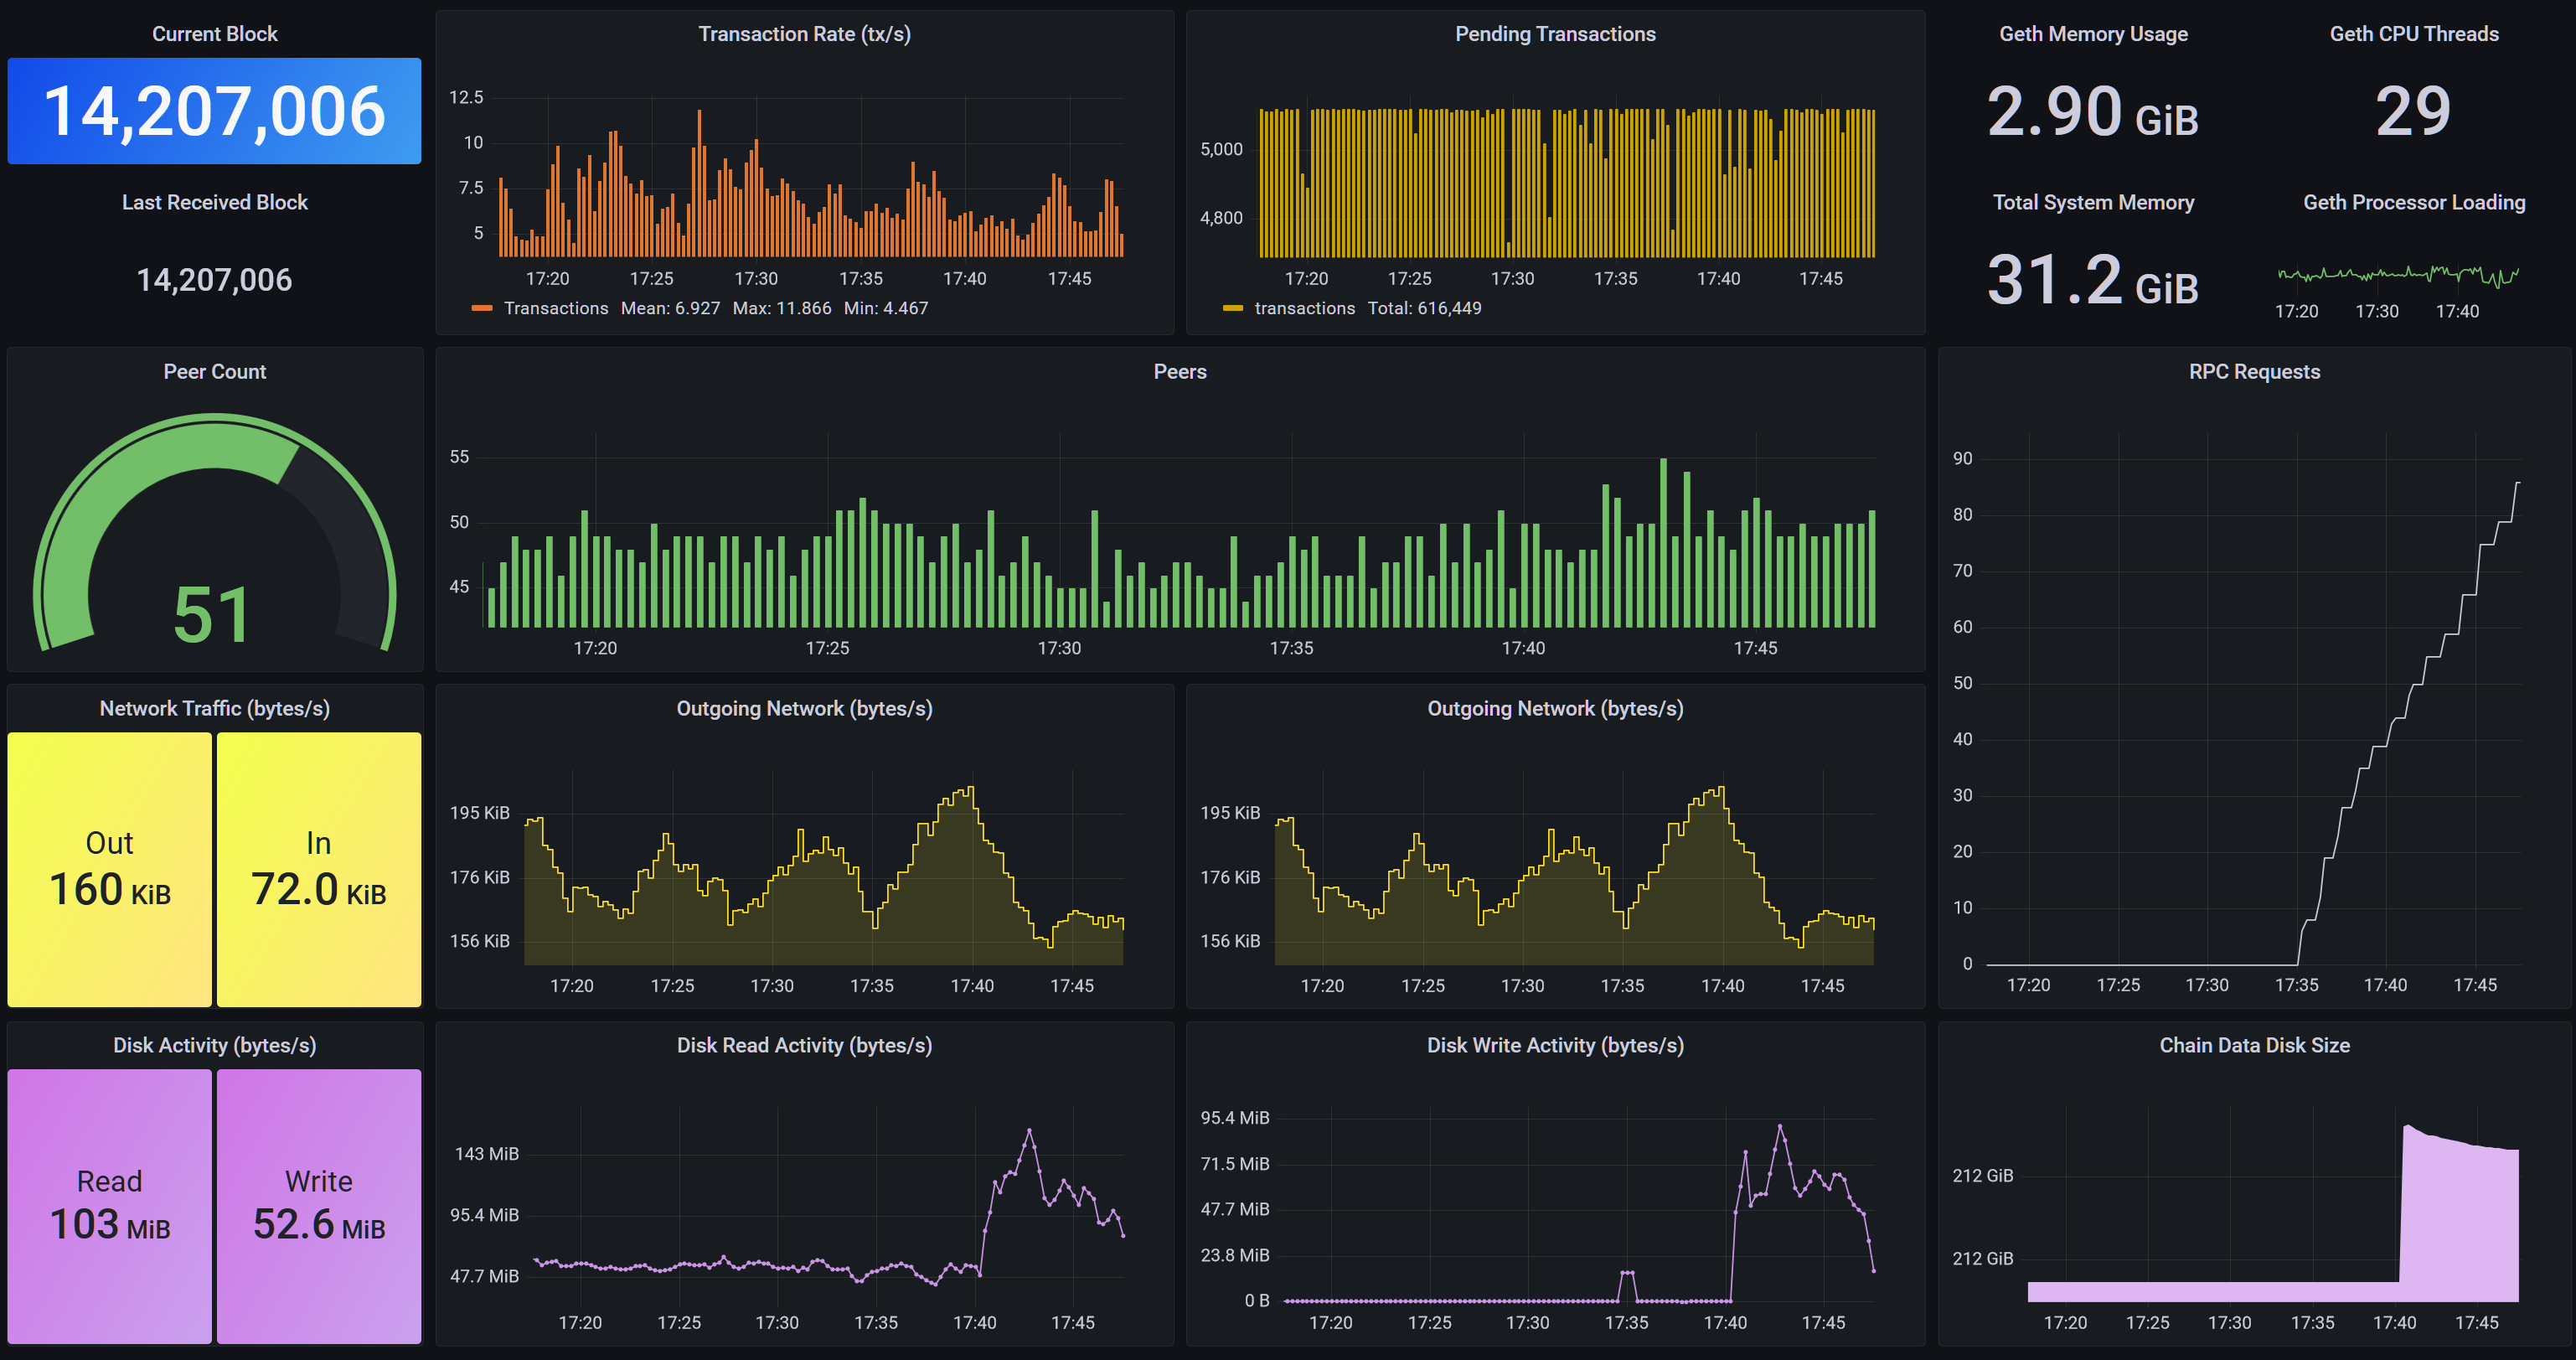
A dashboard compatible with the Go Ethereum built in Prometheus metrics as of Feb 2022 (Faryar (v1.10.15))
Screenshots
Used Metrics 1515
chain_head_block
chain_head_receipt
eth_db_chaindata_disk_size
-
node_memory_MemTotal_bytes
p2p_egress
p2p_ingress
p2p_peers
rpc_requests
system_cpu_procload
system_cpu_threads
system_disk_readbytes
system_disk_writebytes
system_memory_used
txpool_known
txpool_pending
Get Dashboard✕
Download
Copy to Clipboard