Generic Node 2,1862,186
9/25/2017
9/25/2017
1
Host Metrics
>=4.3.1
Prometheus
Description
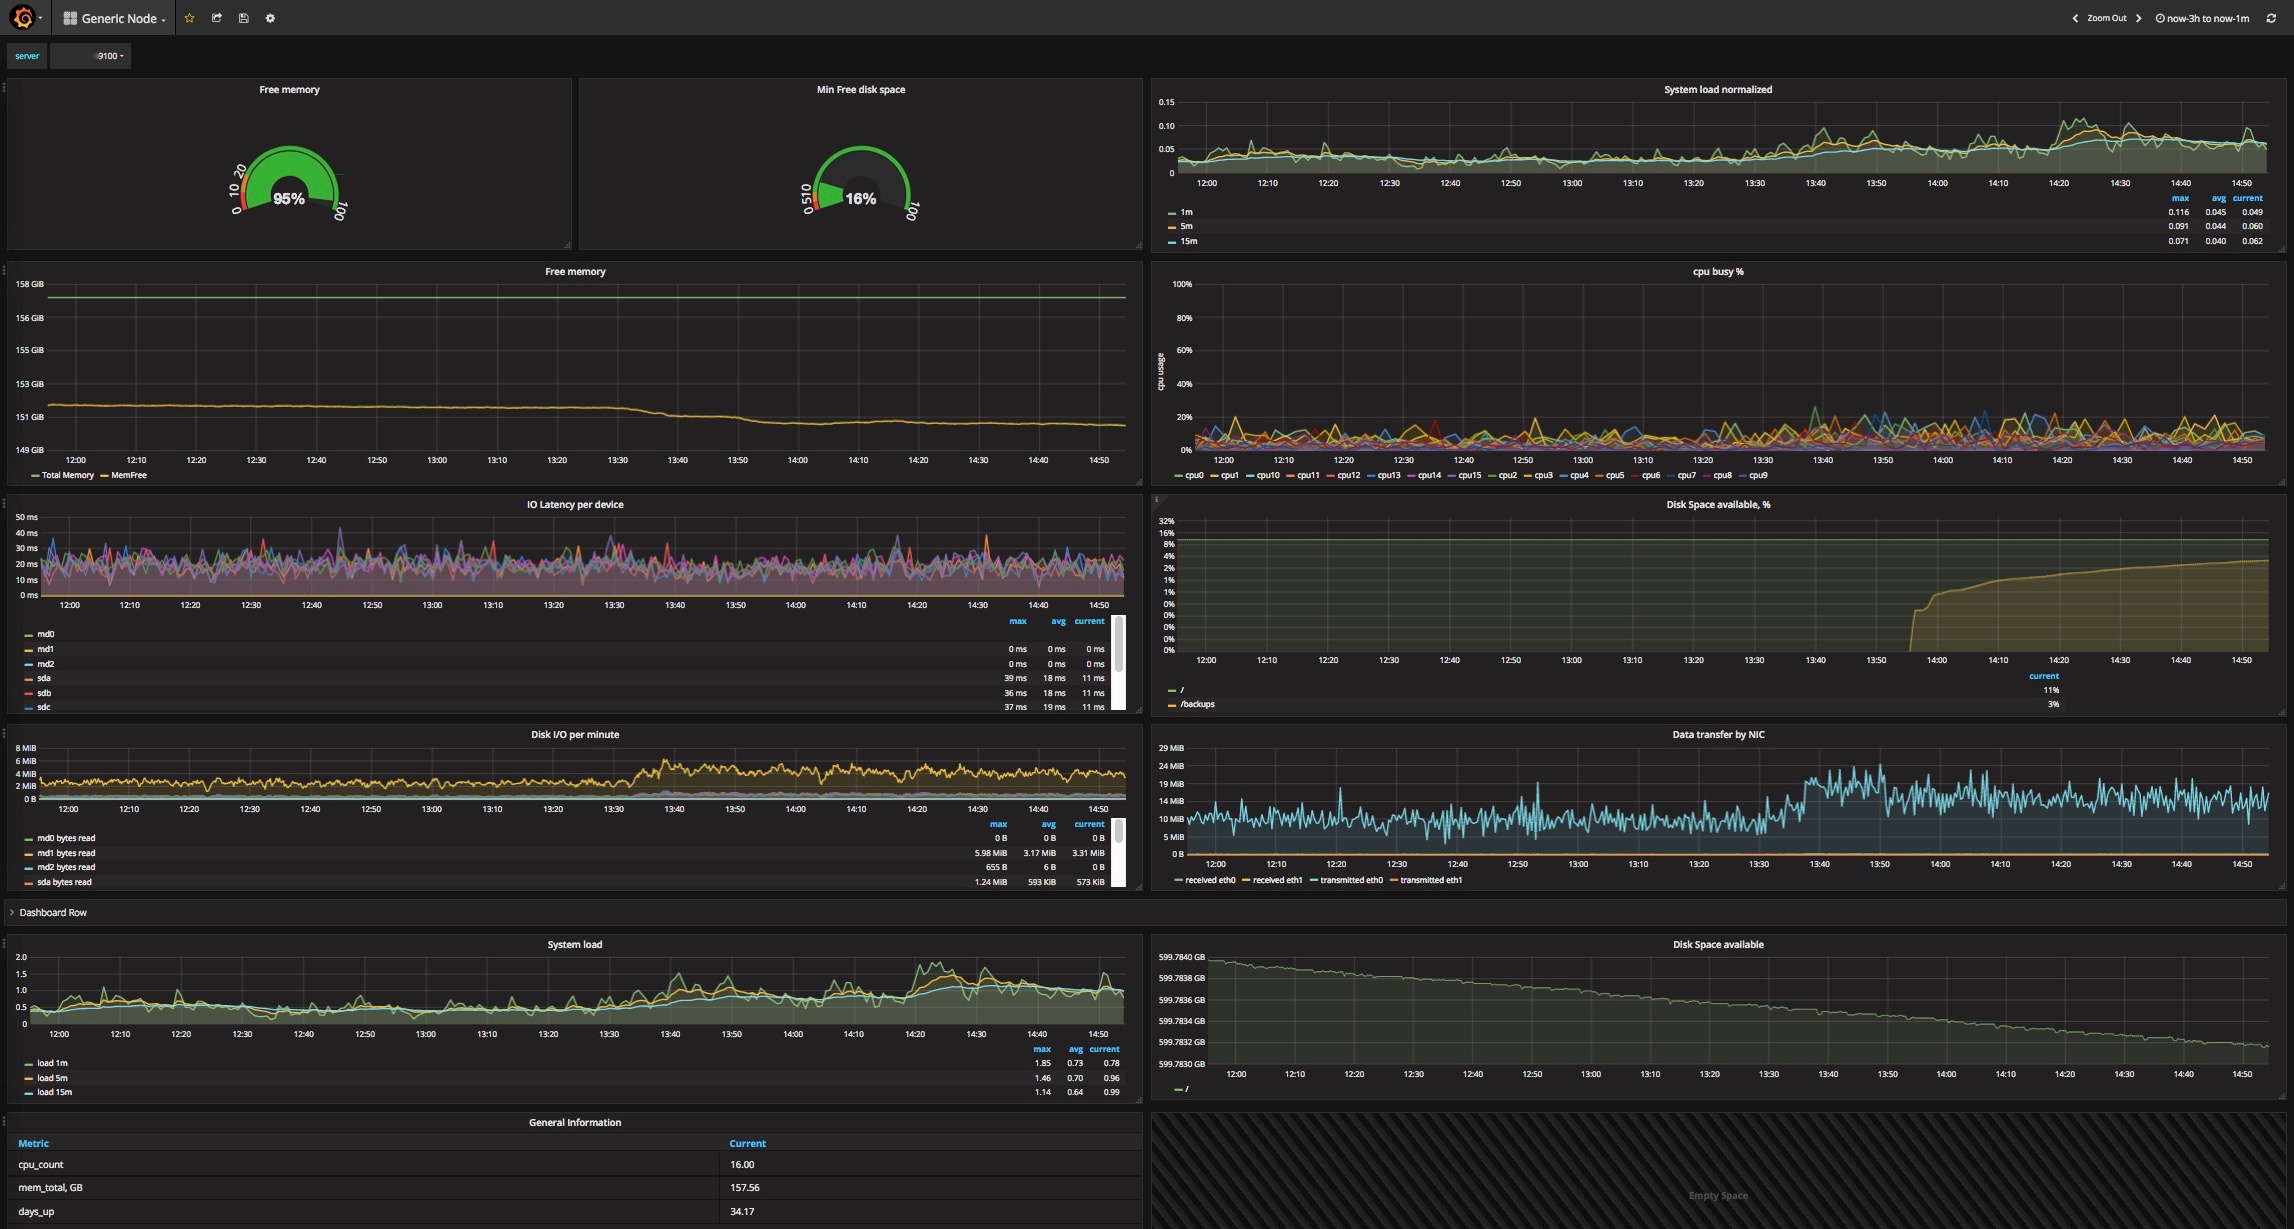
Dashboard to get an overview of one Linux server.
Screenshots
Get Dashboard✕
Download
Copy to Clipboard
Dashboard to get an overview of one Linux server.