FRITZ!Box Status 2,9832,983 4.0 (2 reviews)
7/5/2020
12/19/2020
8
>=7.3.6
Prometheus
Description
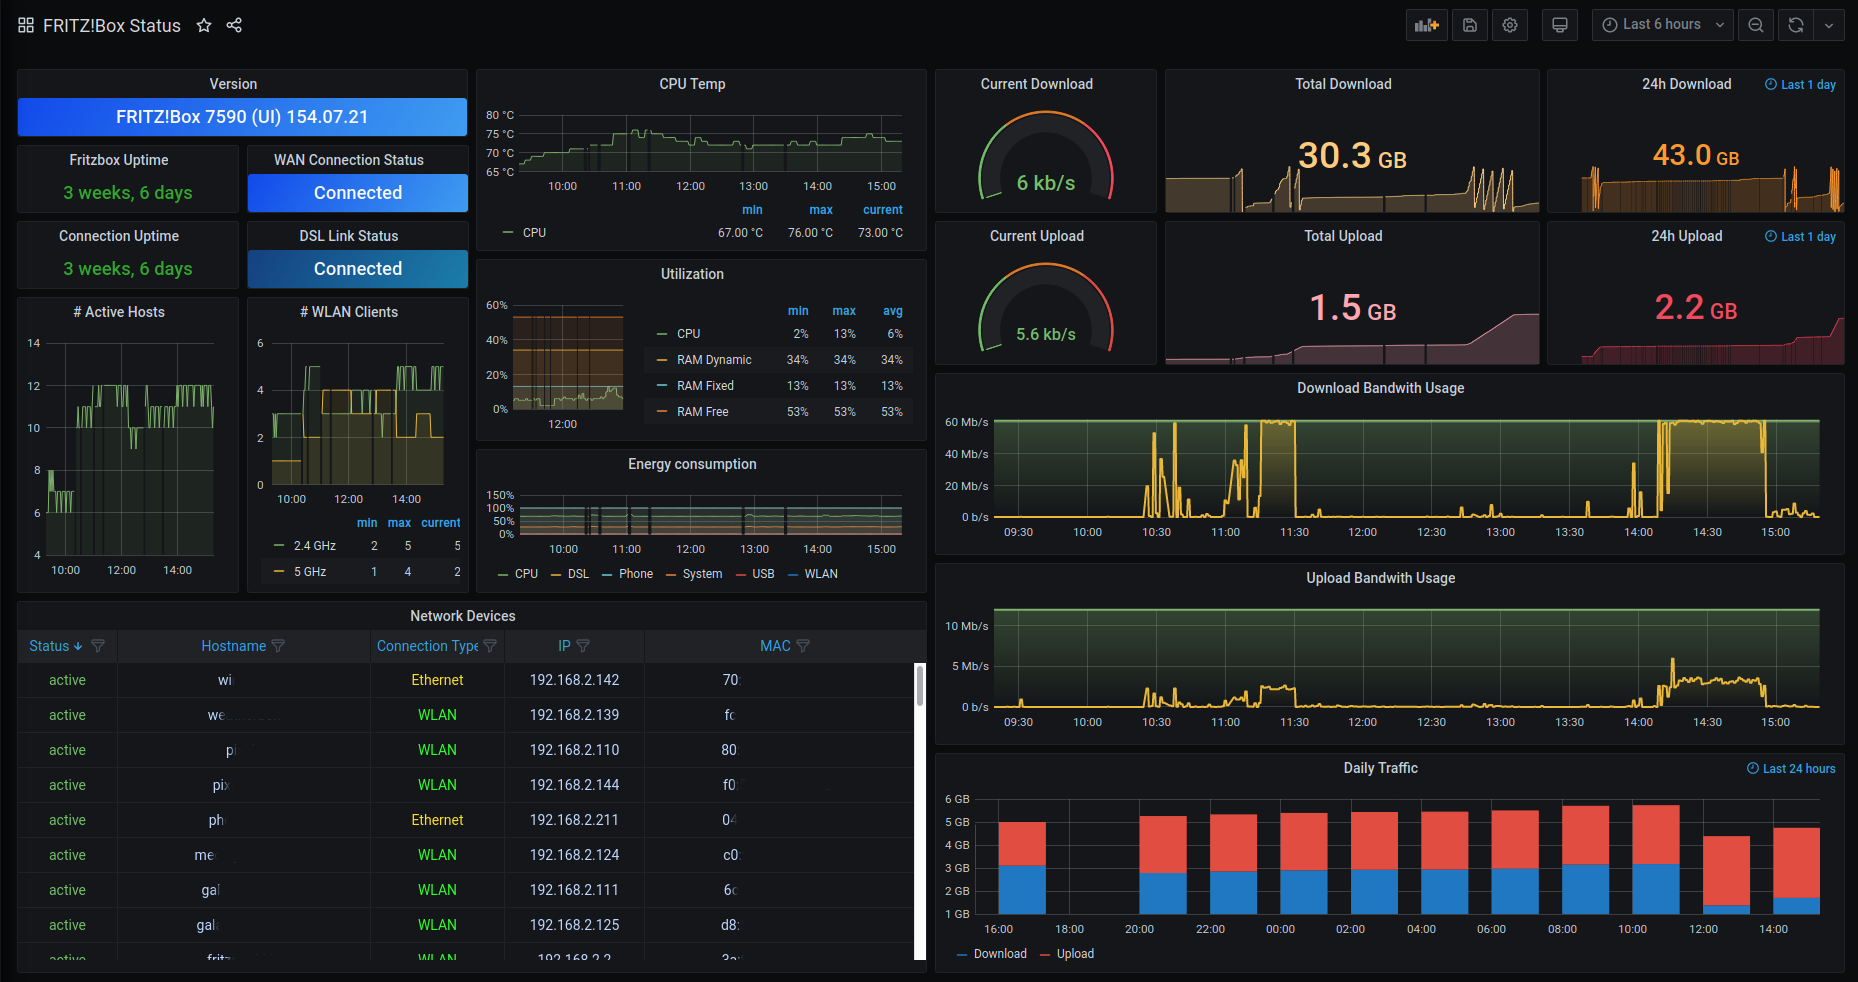
Monitor FRITZ!Box routers using prometheus and fritzbox_exporter
Screenshots
Used Metrics 1313
gateway_connection_max_bitrate
gateway_connection_status
gateway_connection_uptime_seconds
gateway_data_ecostat_cputemp
gateway_data_ecostat_cpuutil
gateway_data_ecostat_ramusage
gateway_data_energy_consumption
gateway_device_modelname
gateway_host_active
gateway_traffic
gateway_traffic_rate
gateway_uptime_seconds
gateway_wlan_current_connections
Get Dashboard✕
Download
Copy to Clipboard