freeswitch 1,2131,213 5.0 (3 reviews)
9/28/2022
9/28/2022
1
>=8.2.2
Prometheus
Description
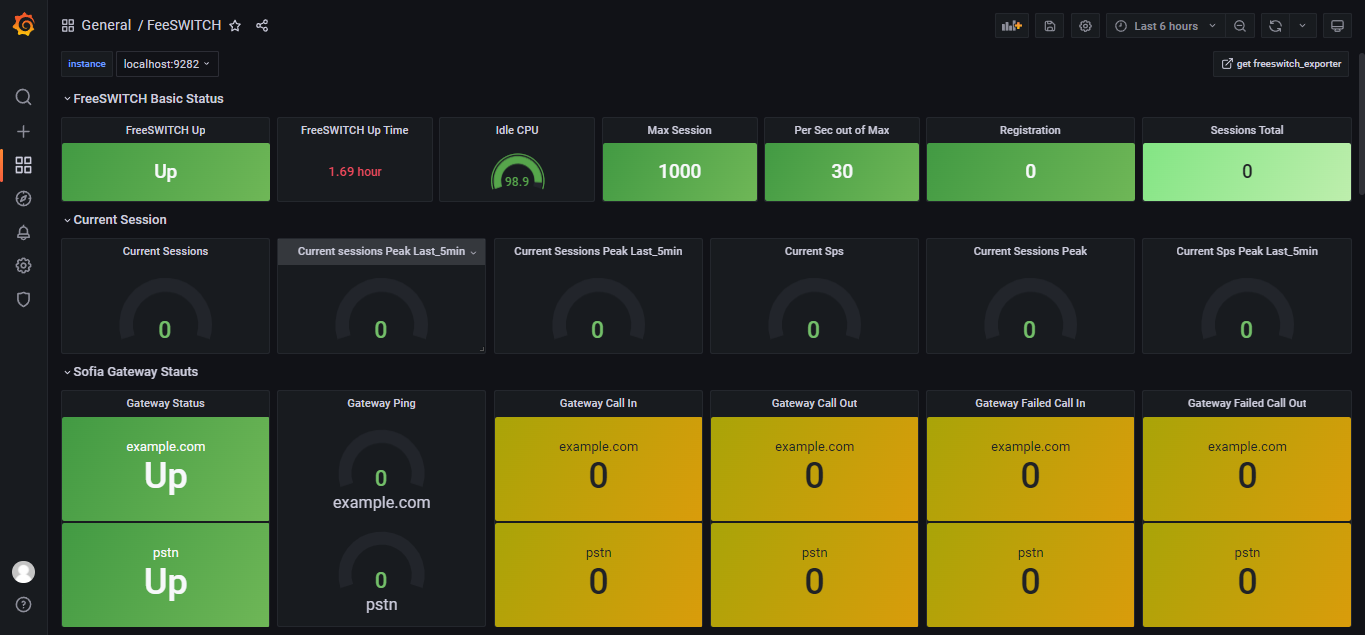
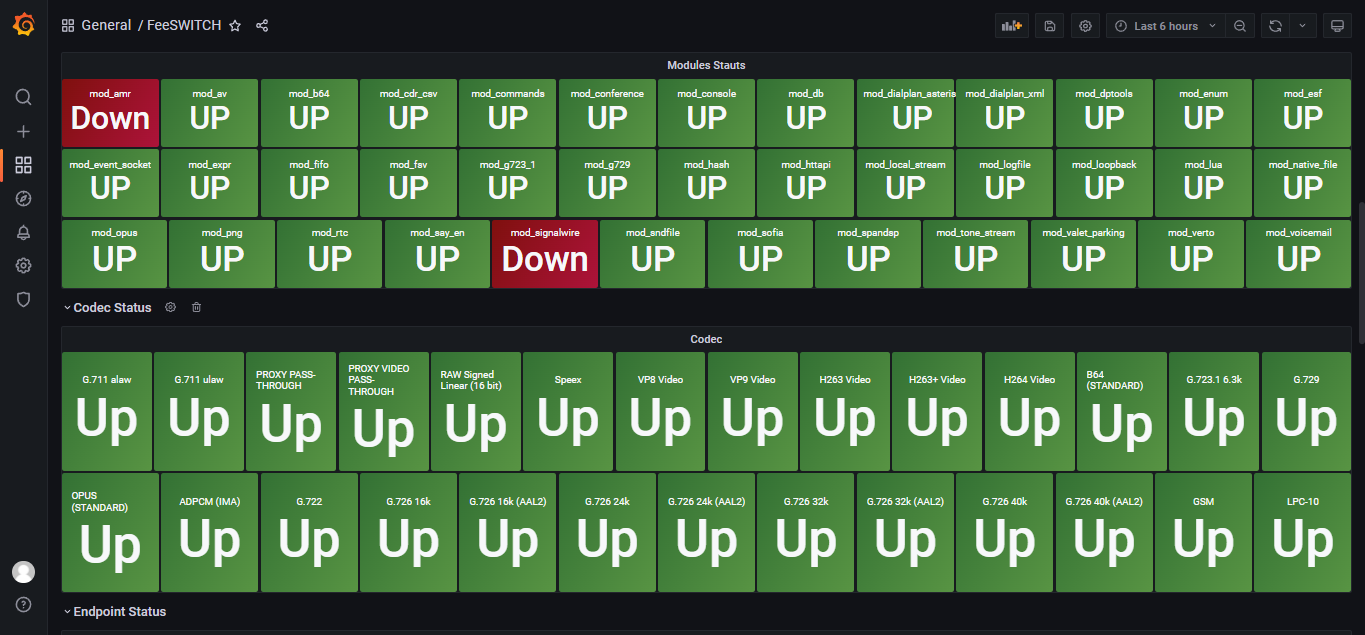
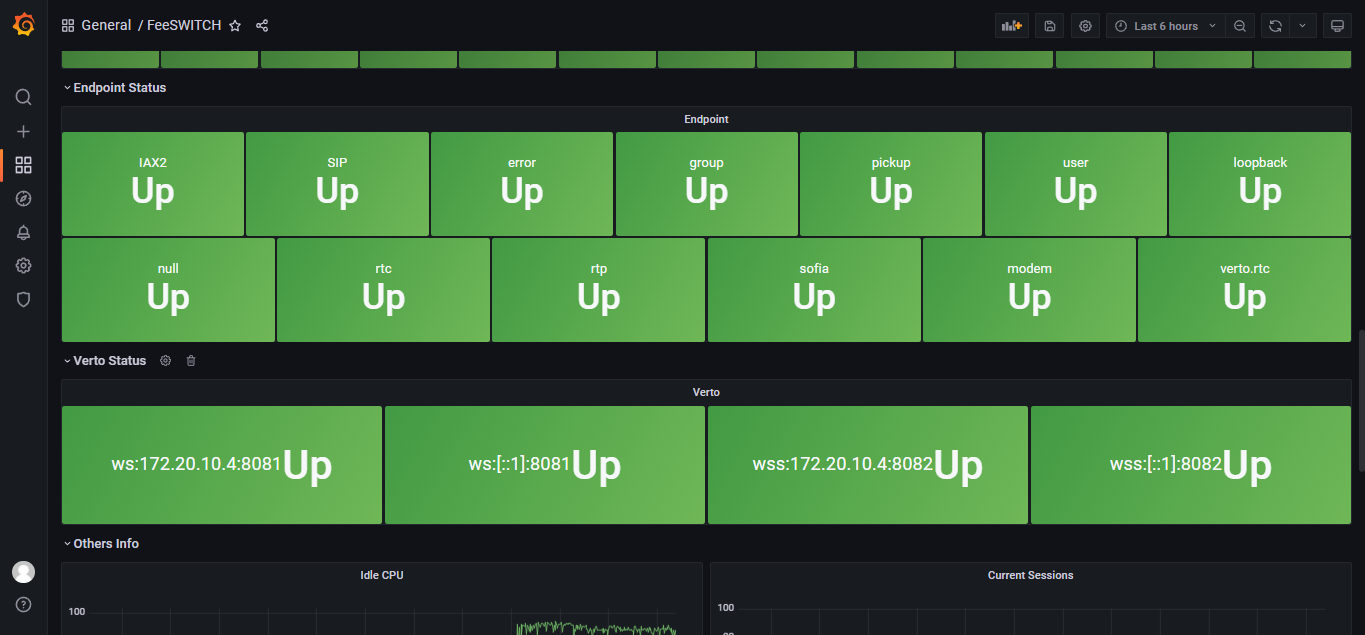
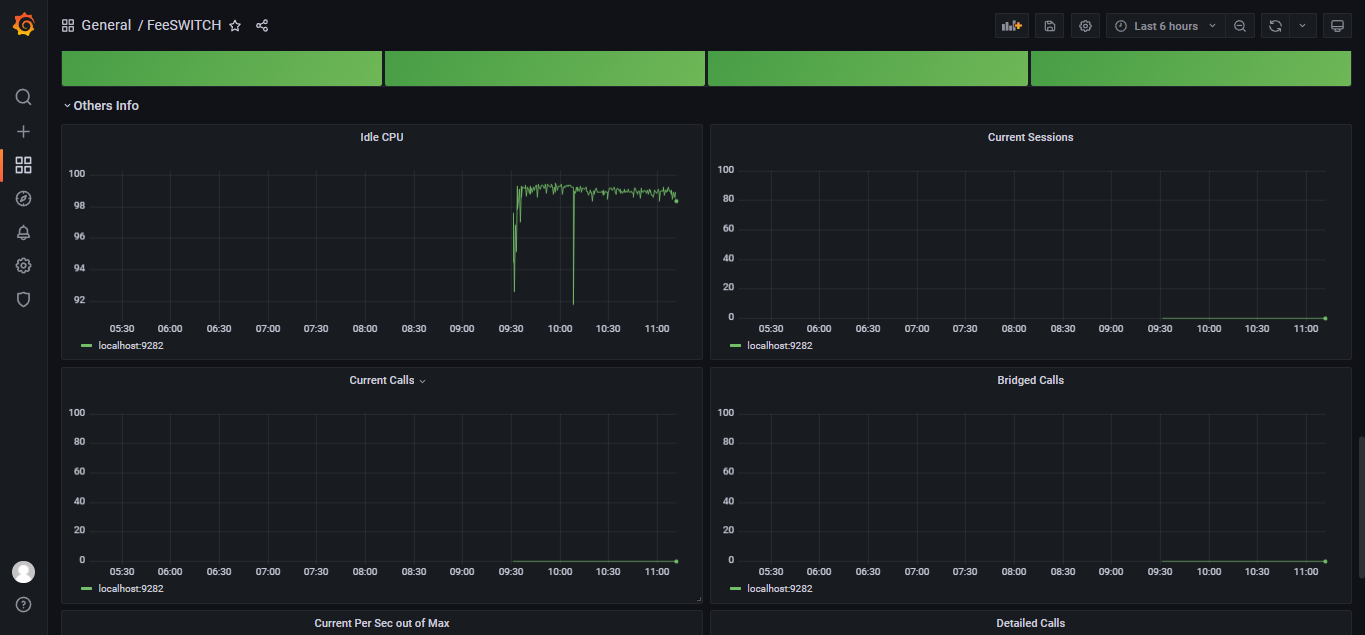
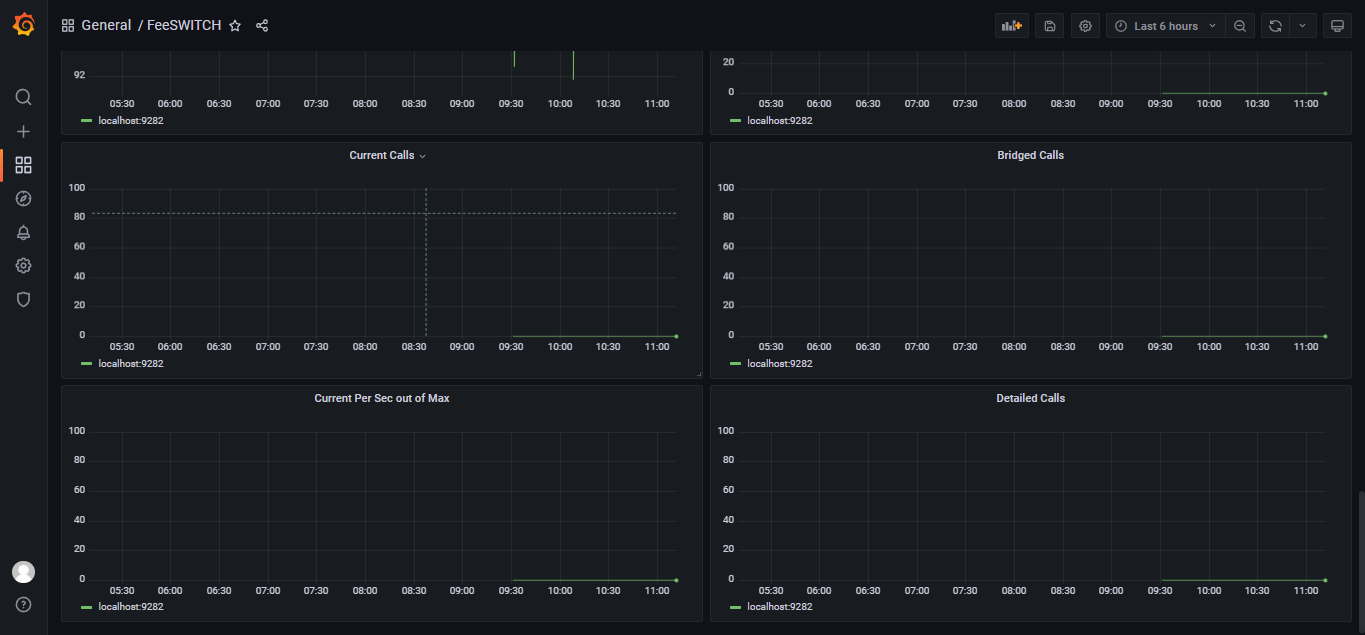
A freeswitch dashboard from freeswitch_exporter
Screenshots
Used Metrics 2525
freeswitch_bridged_calls
freeswitch_codec_status
freeswitch_current_calls
freeswitch_current_idle_cpu
freeswitch_current_sessions
freeswitch_current_sessions_peak
freeswitch_current_sessions_peak_last_in
freeswitch_current_sps
freeswitch_current_sps_peak_last_in
freeswitch_detailed_calls
freeswitch_endpoint_status
freeswitch_load_module
freeswitch_max_sessions
freeswitch_max_sps
freeswitch_registrations
freeswitch_sessions_total
freeswitch_sofia_gateway_call_in
freeswitch_sofia_gateway_call_out
freeswitch_sofia_gateway_failed_call_in
freeswitch_sofia_gateway_failed_call_out
freeswitch_sofia_gateway_ping
freeswitch_sofia_gateway_status
freeswitch_up
freeswitch_uptime_seconds
freeswitch_verto_status
Get Dashboard✕
Download
Copy to Clipboard