Fortigate Prometheus Exporter 3,6023,602
3/5/2021
1/2/2025
6
>=11.4.0
Prometheus
Description
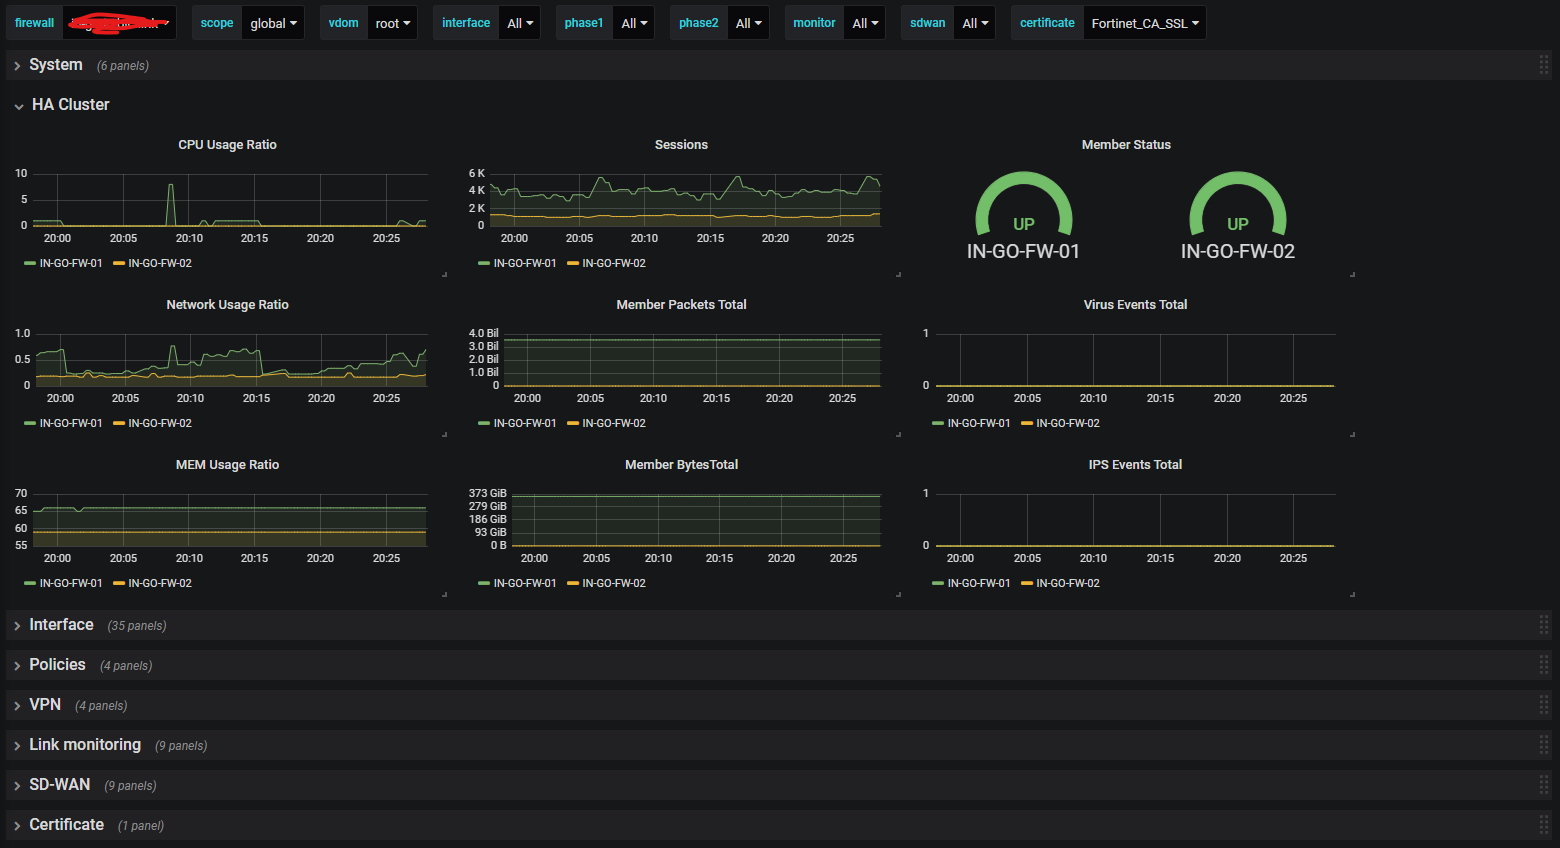
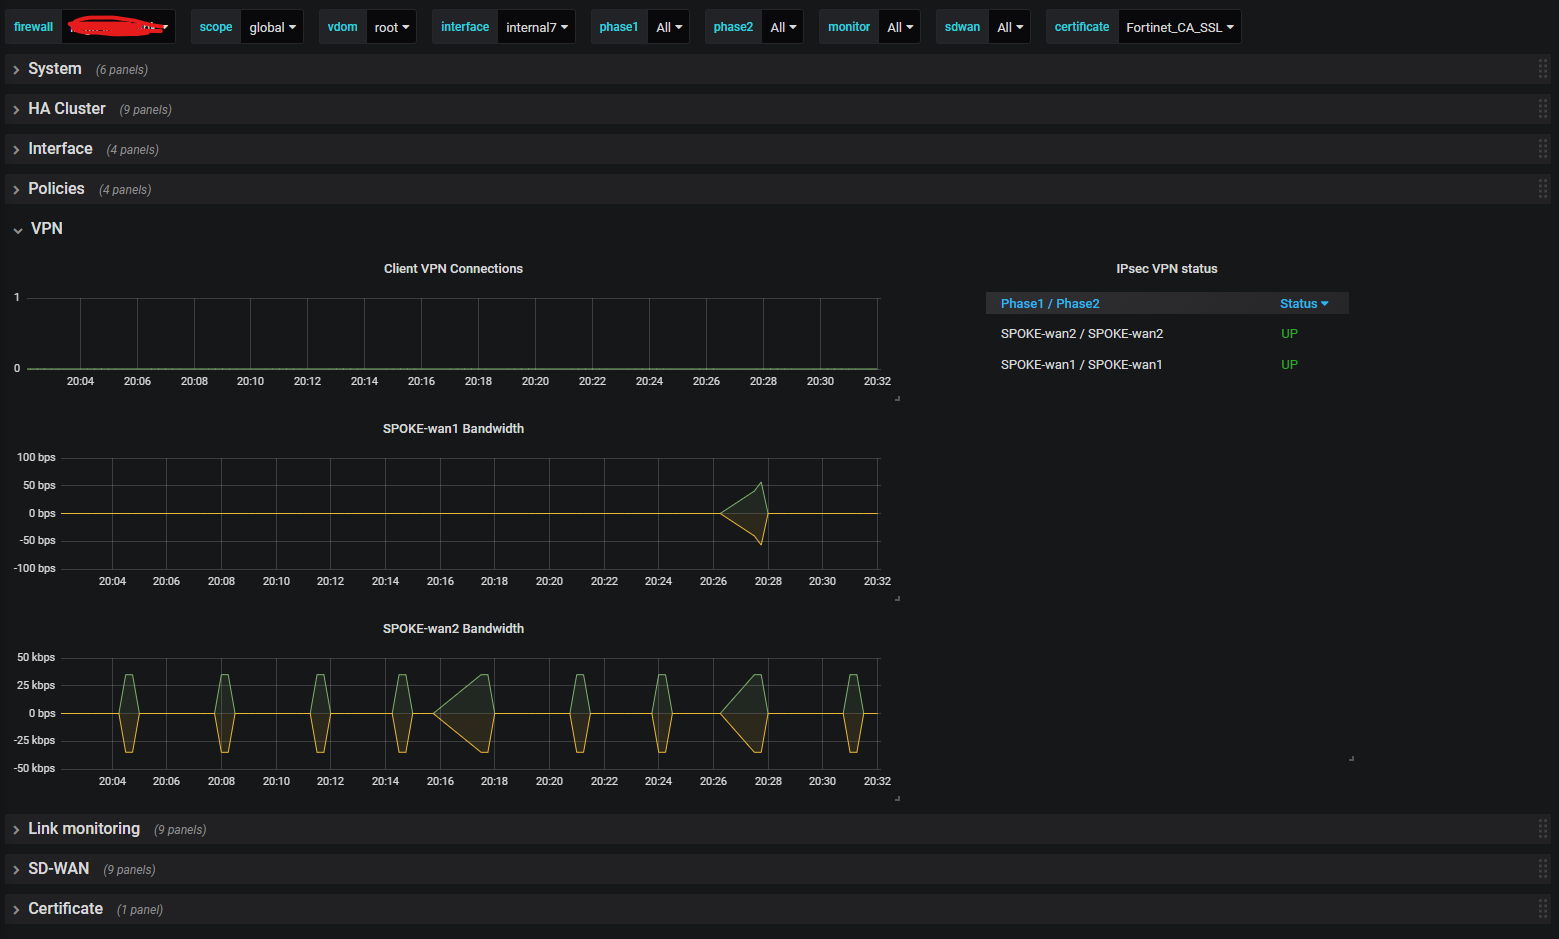
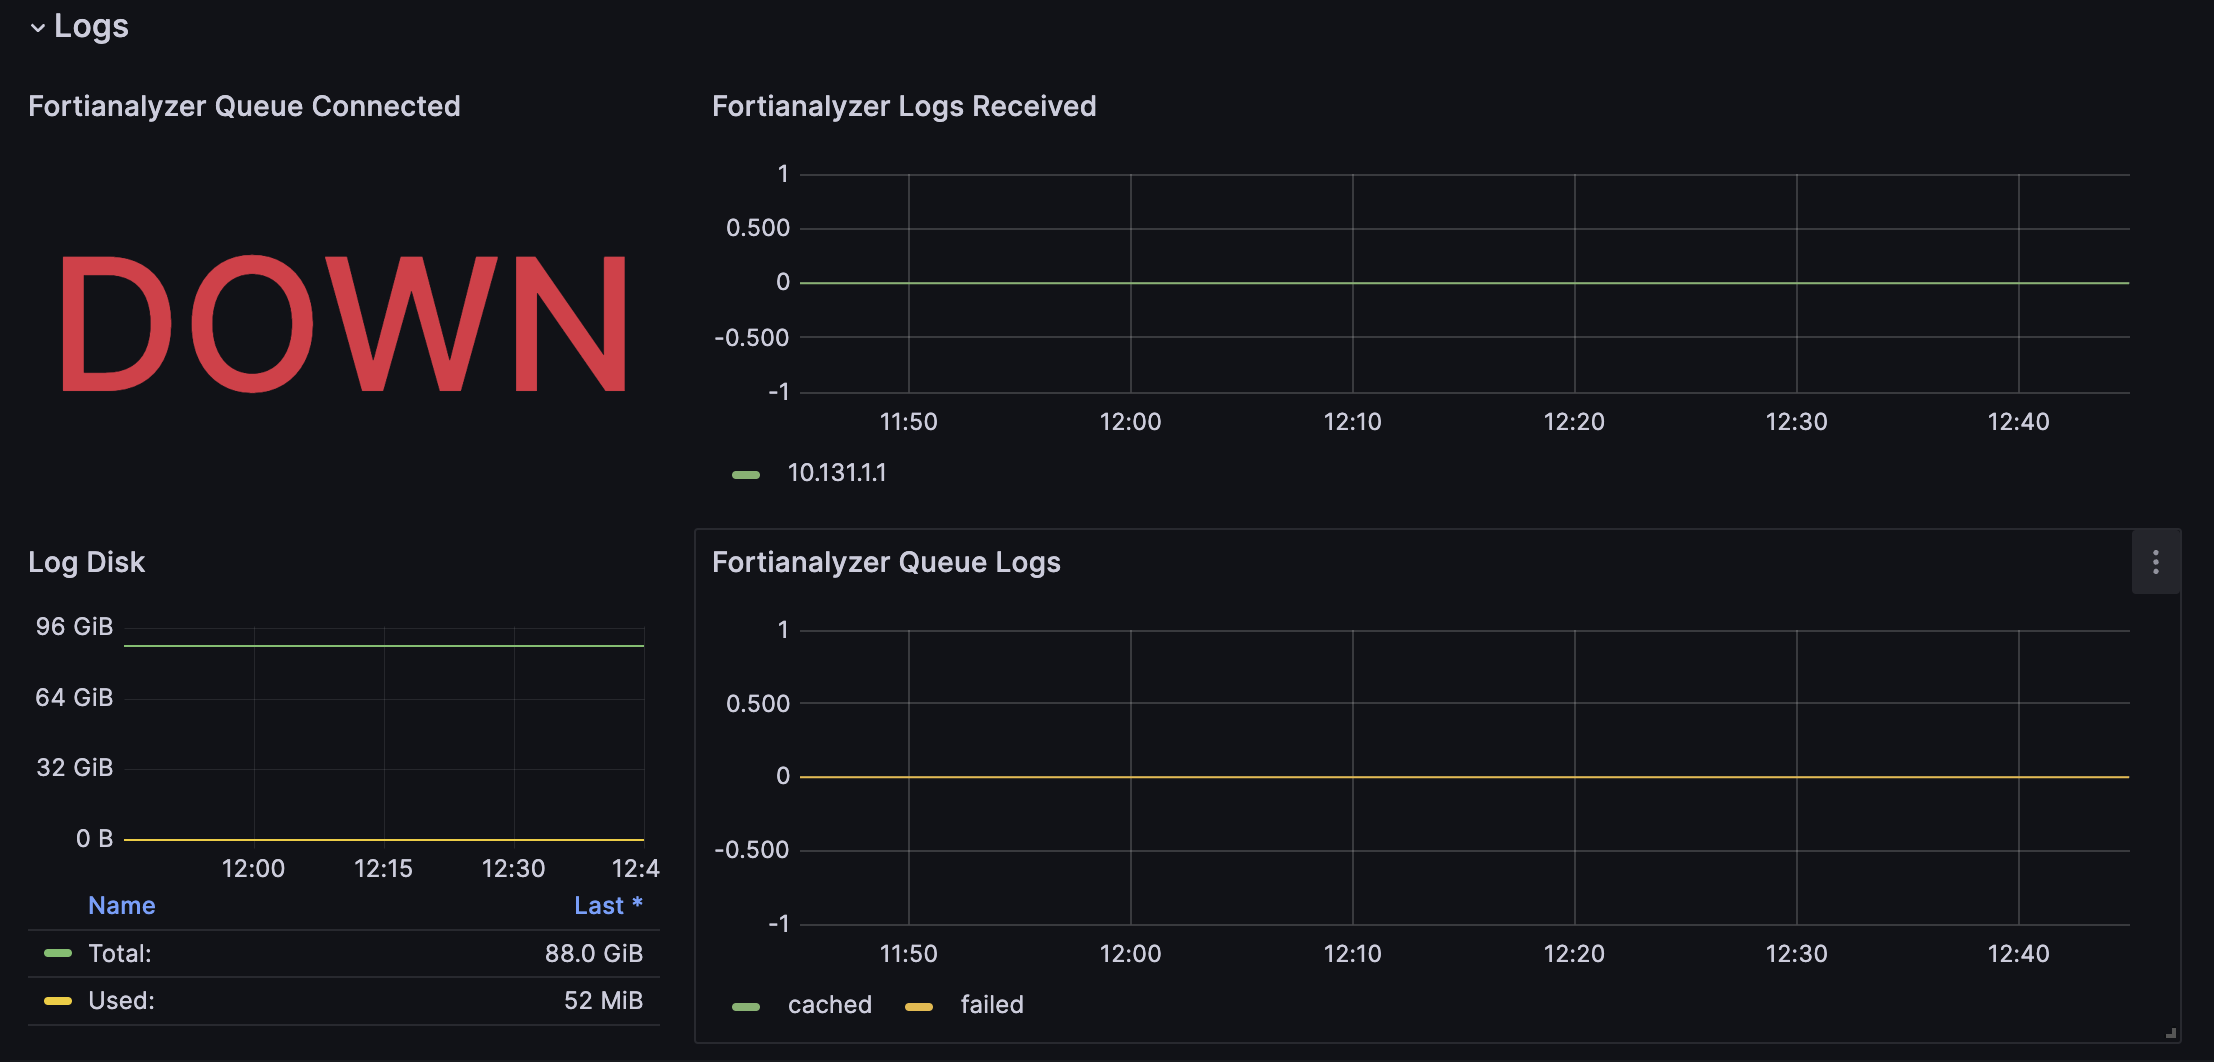
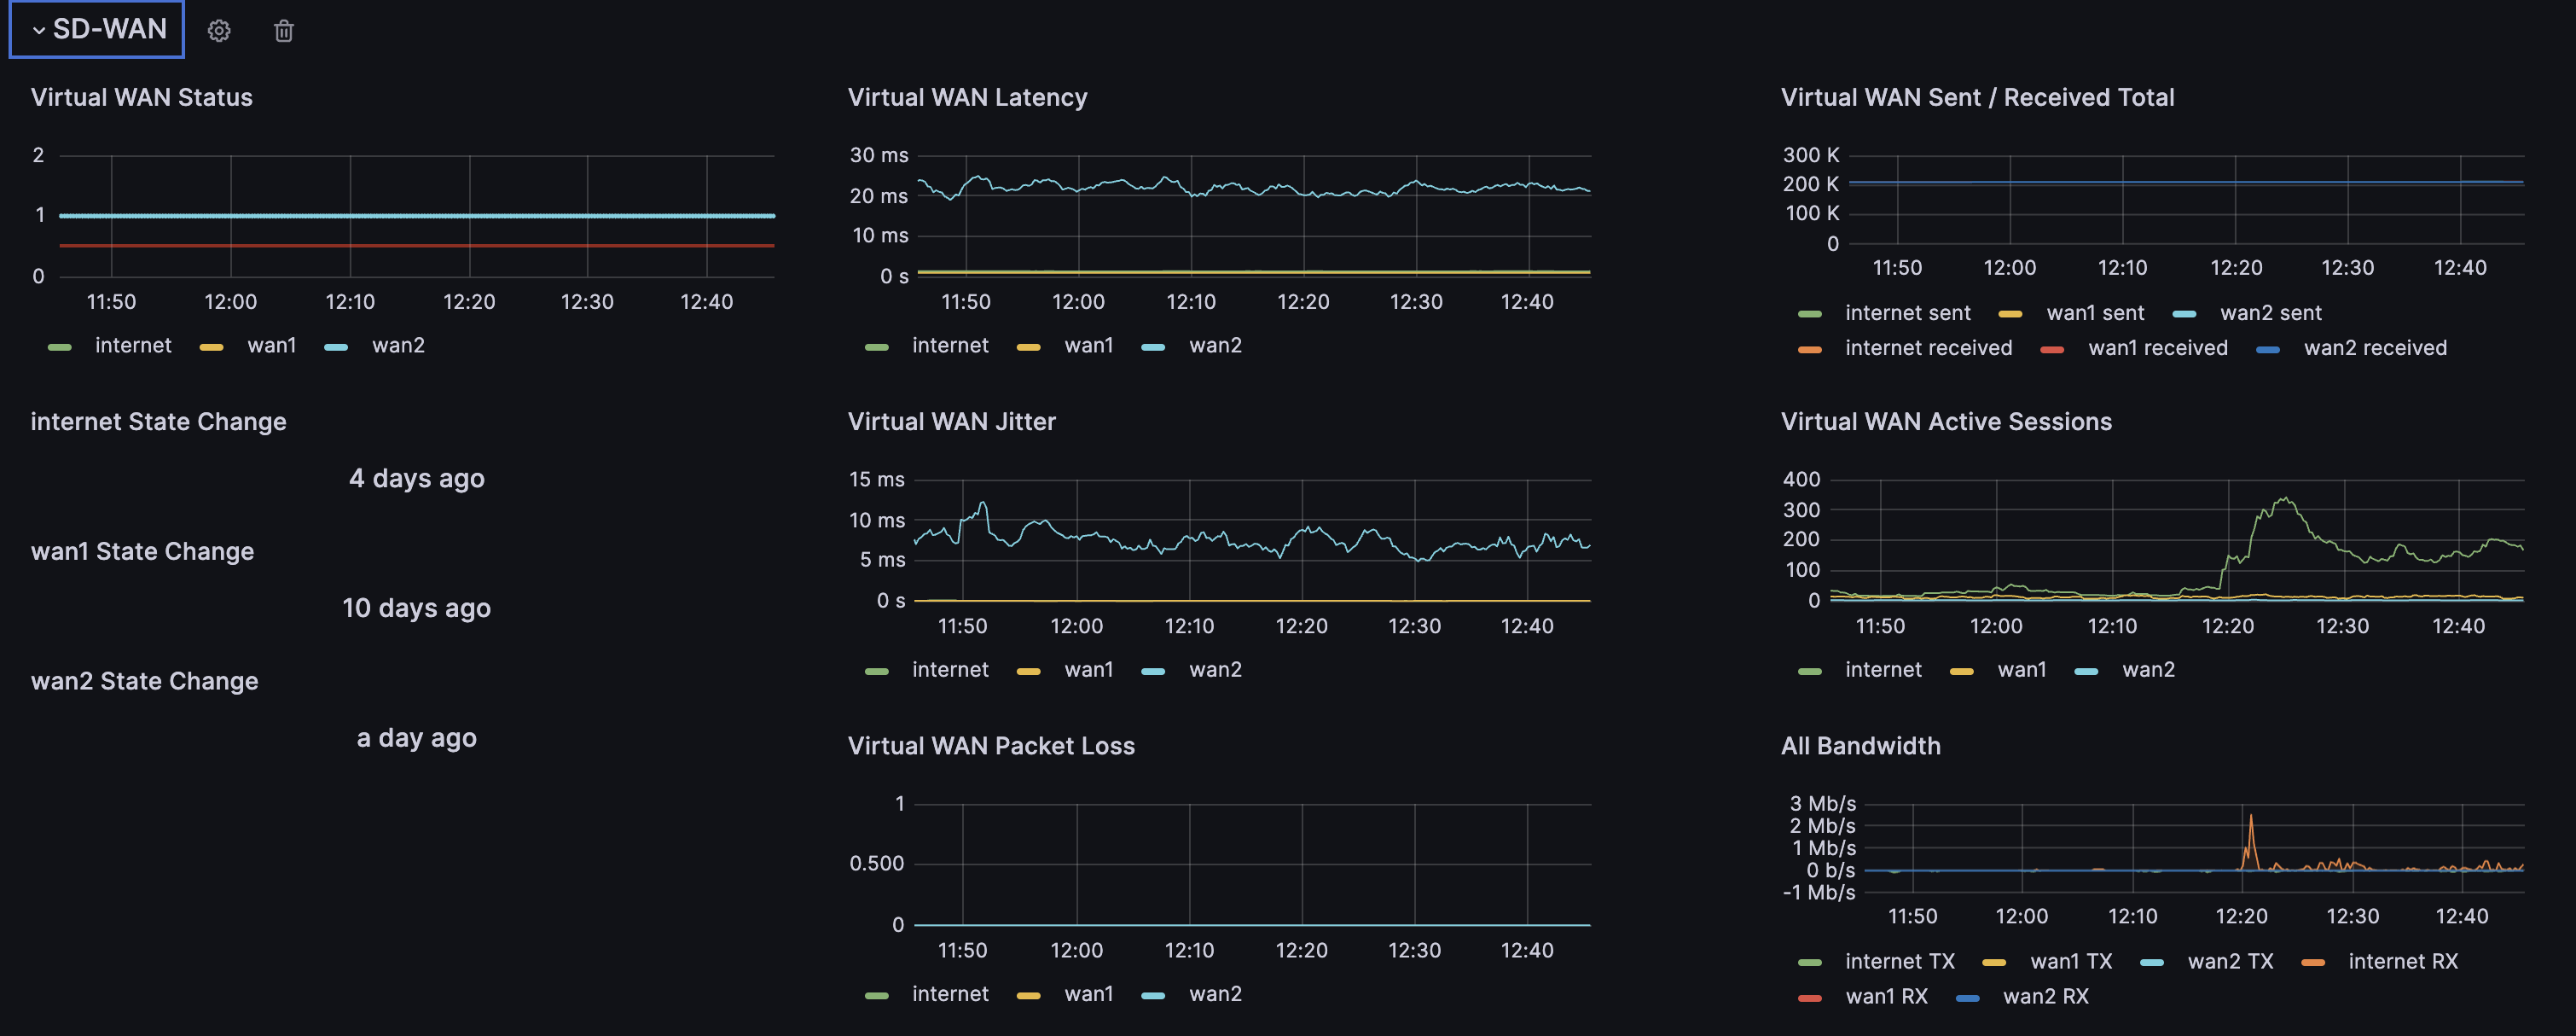
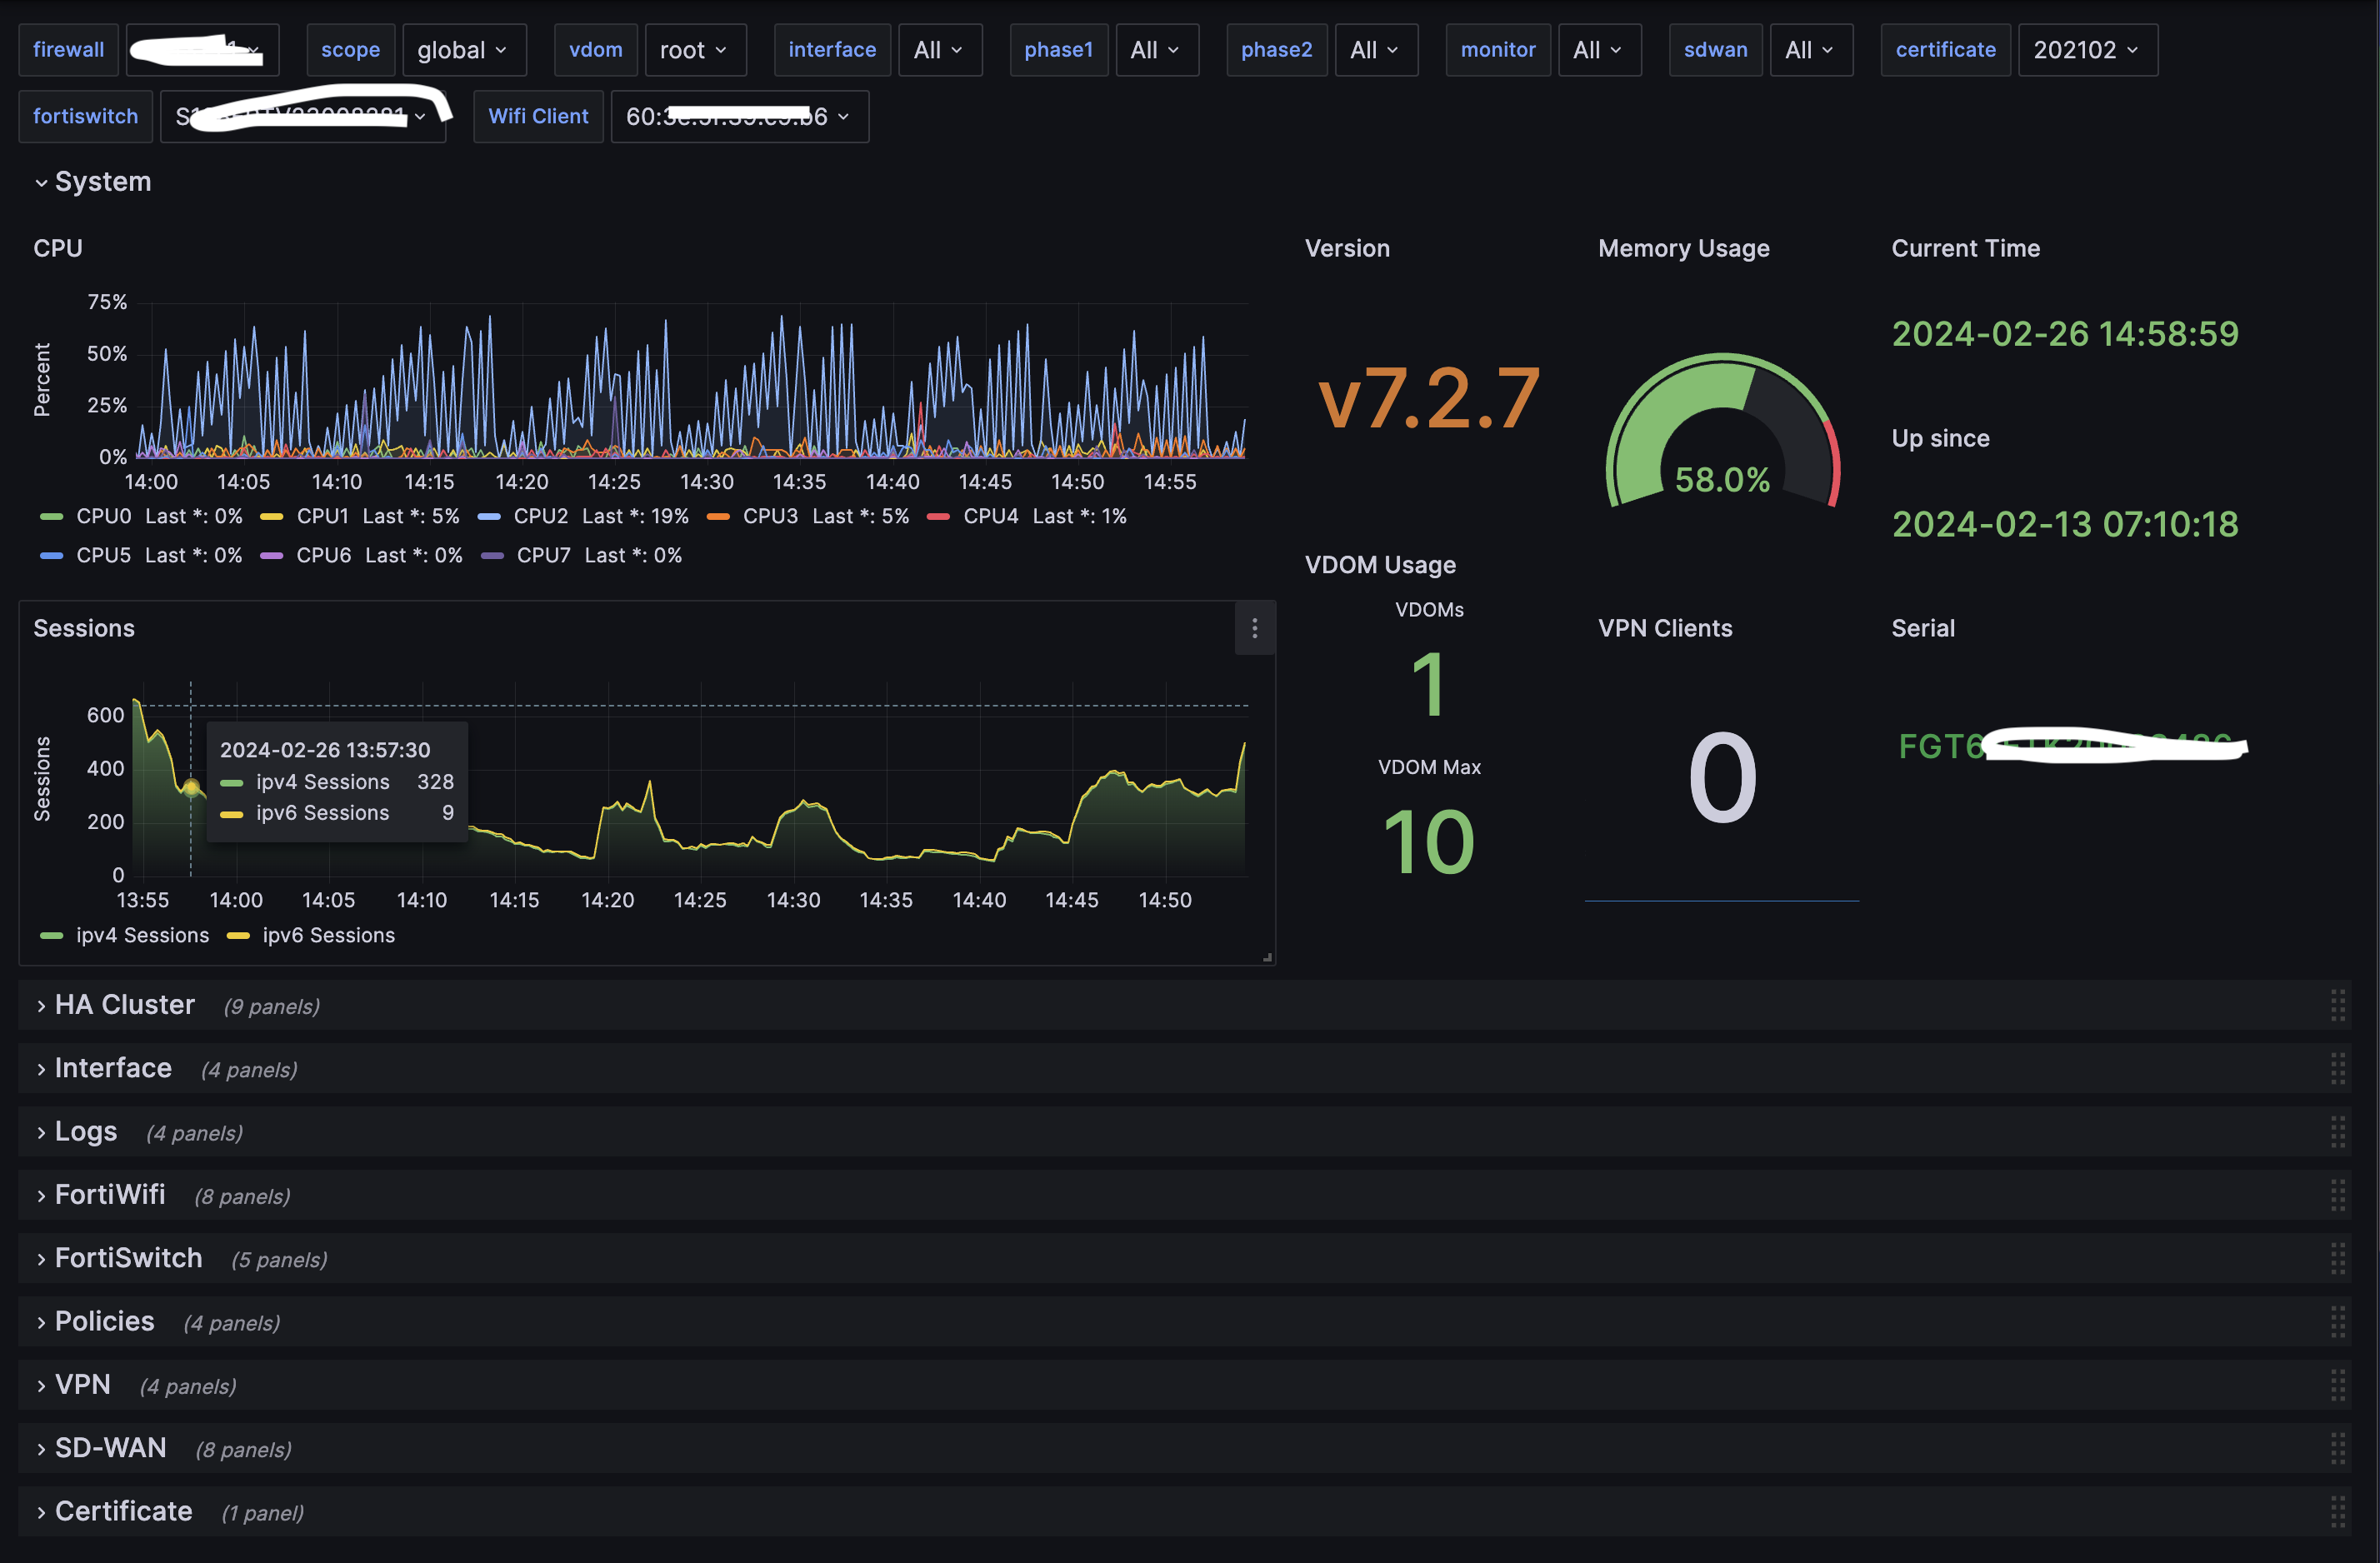
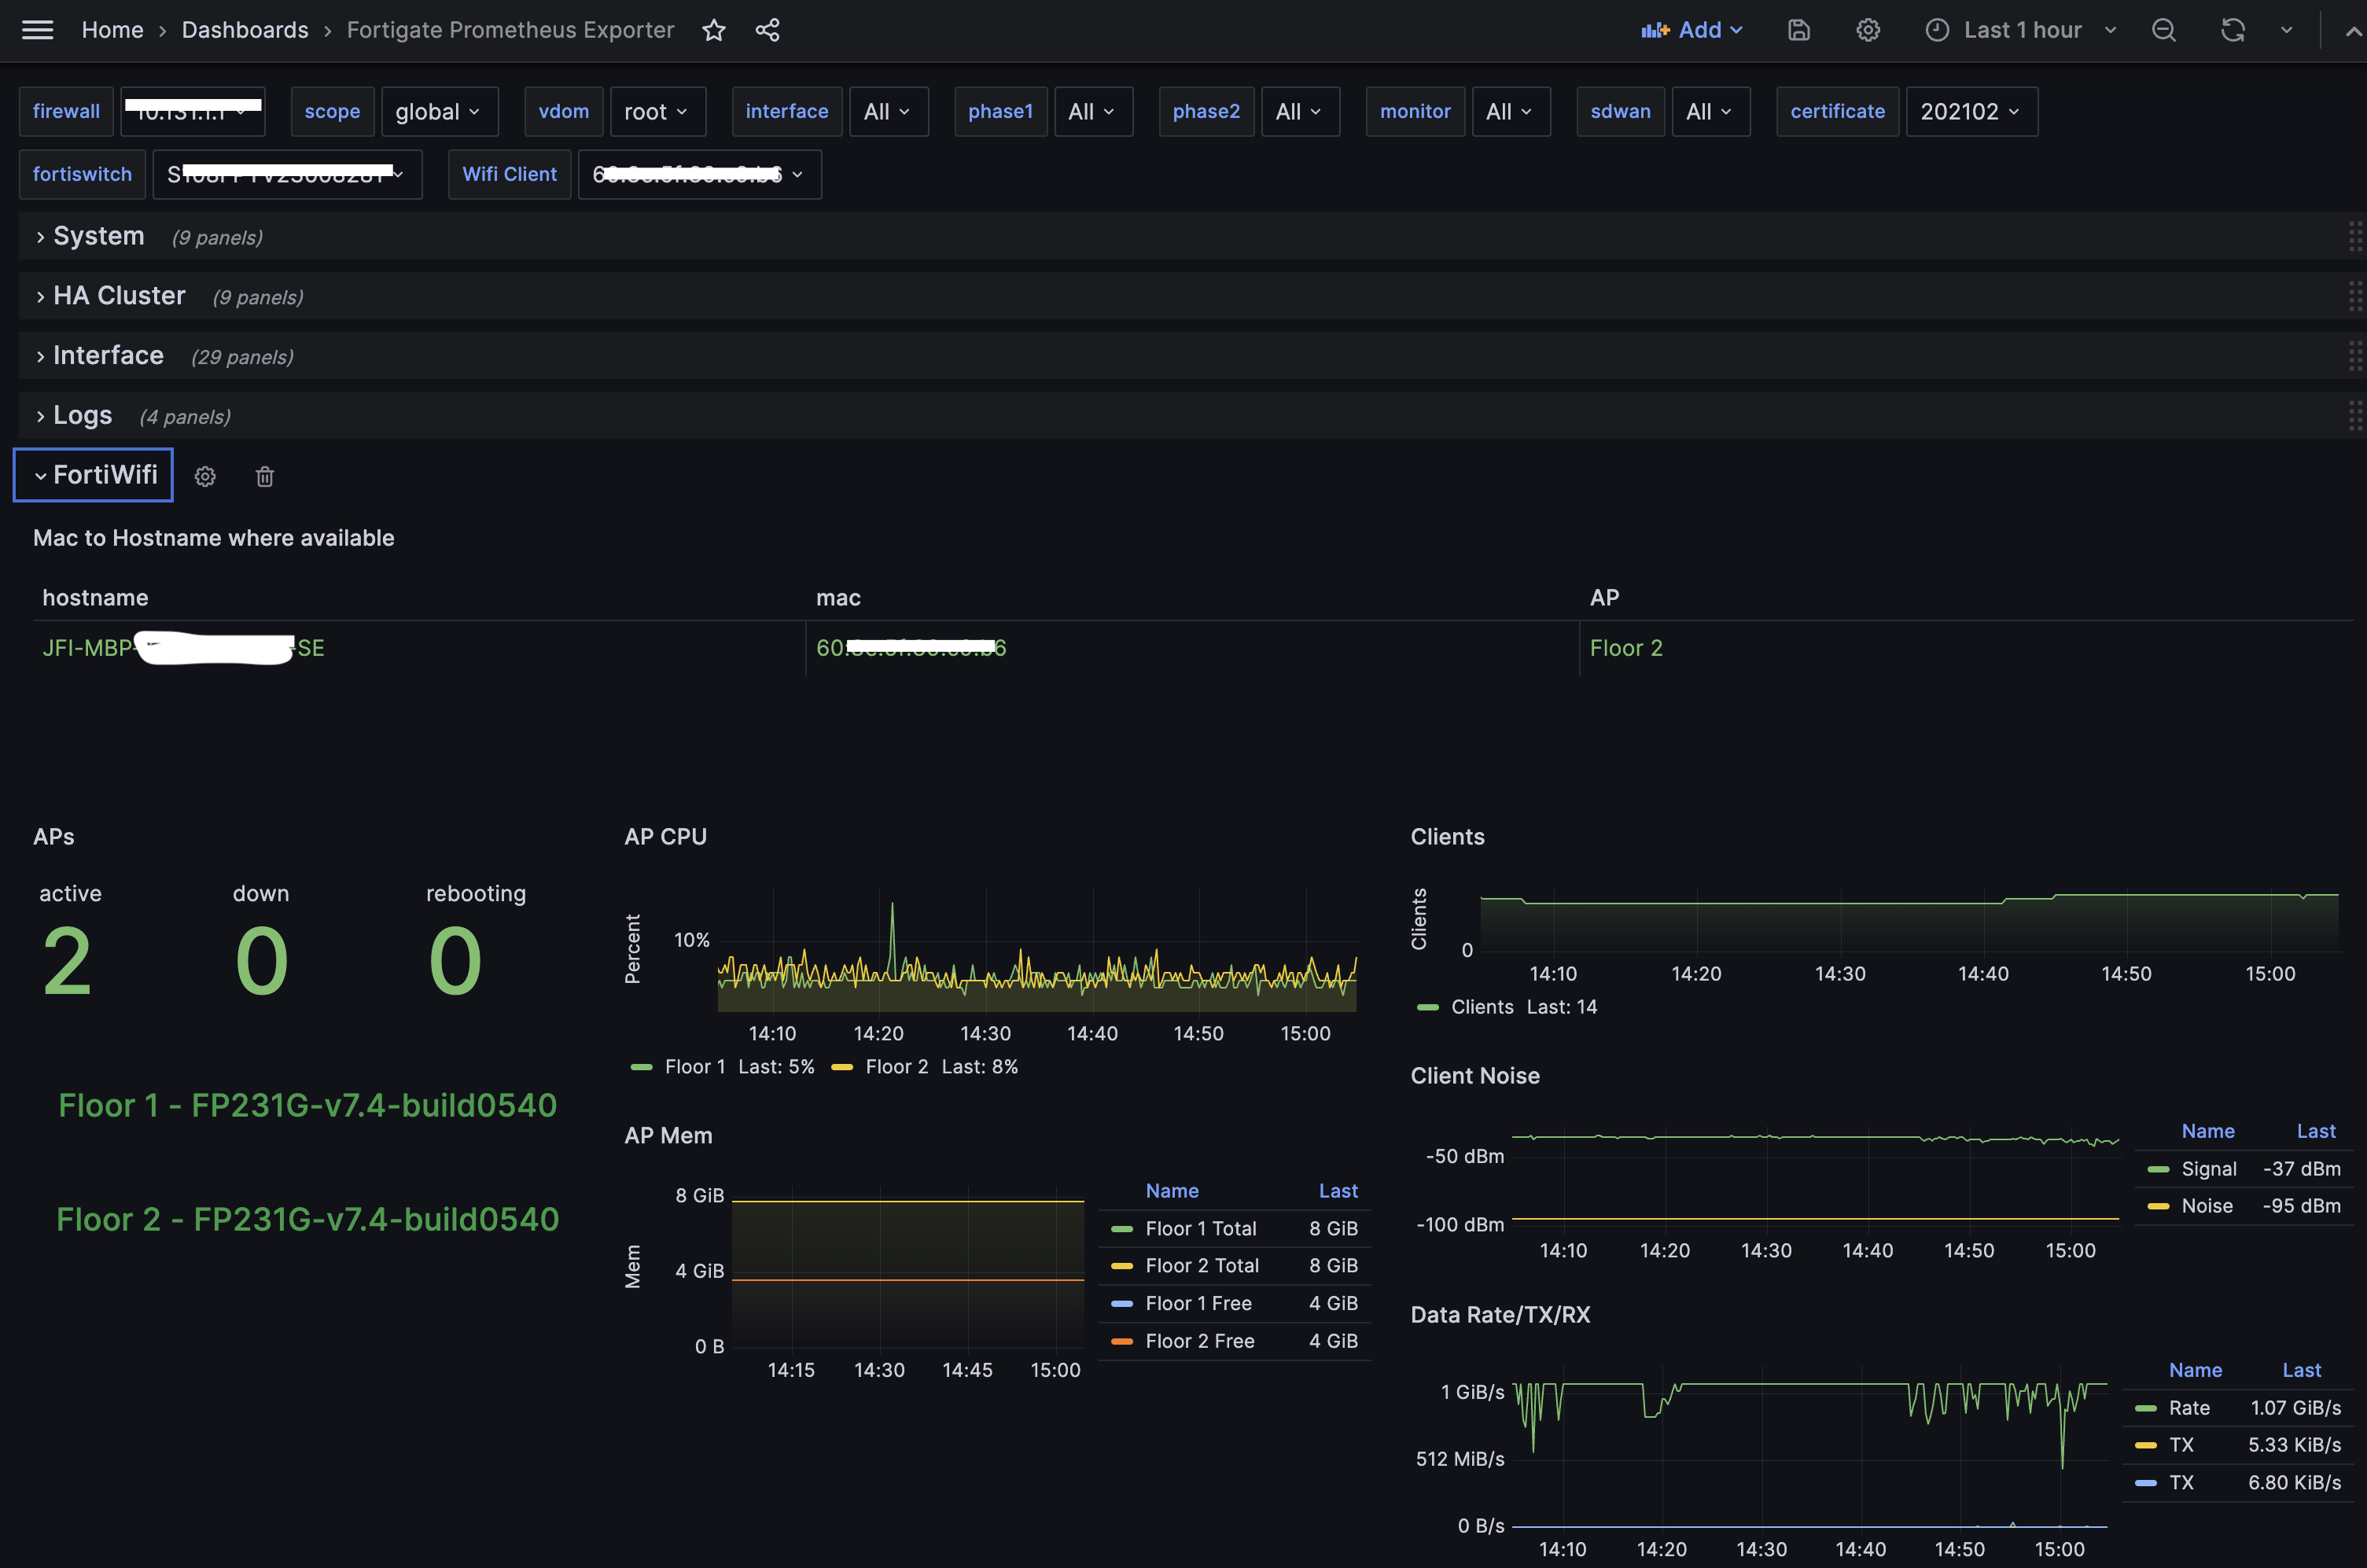
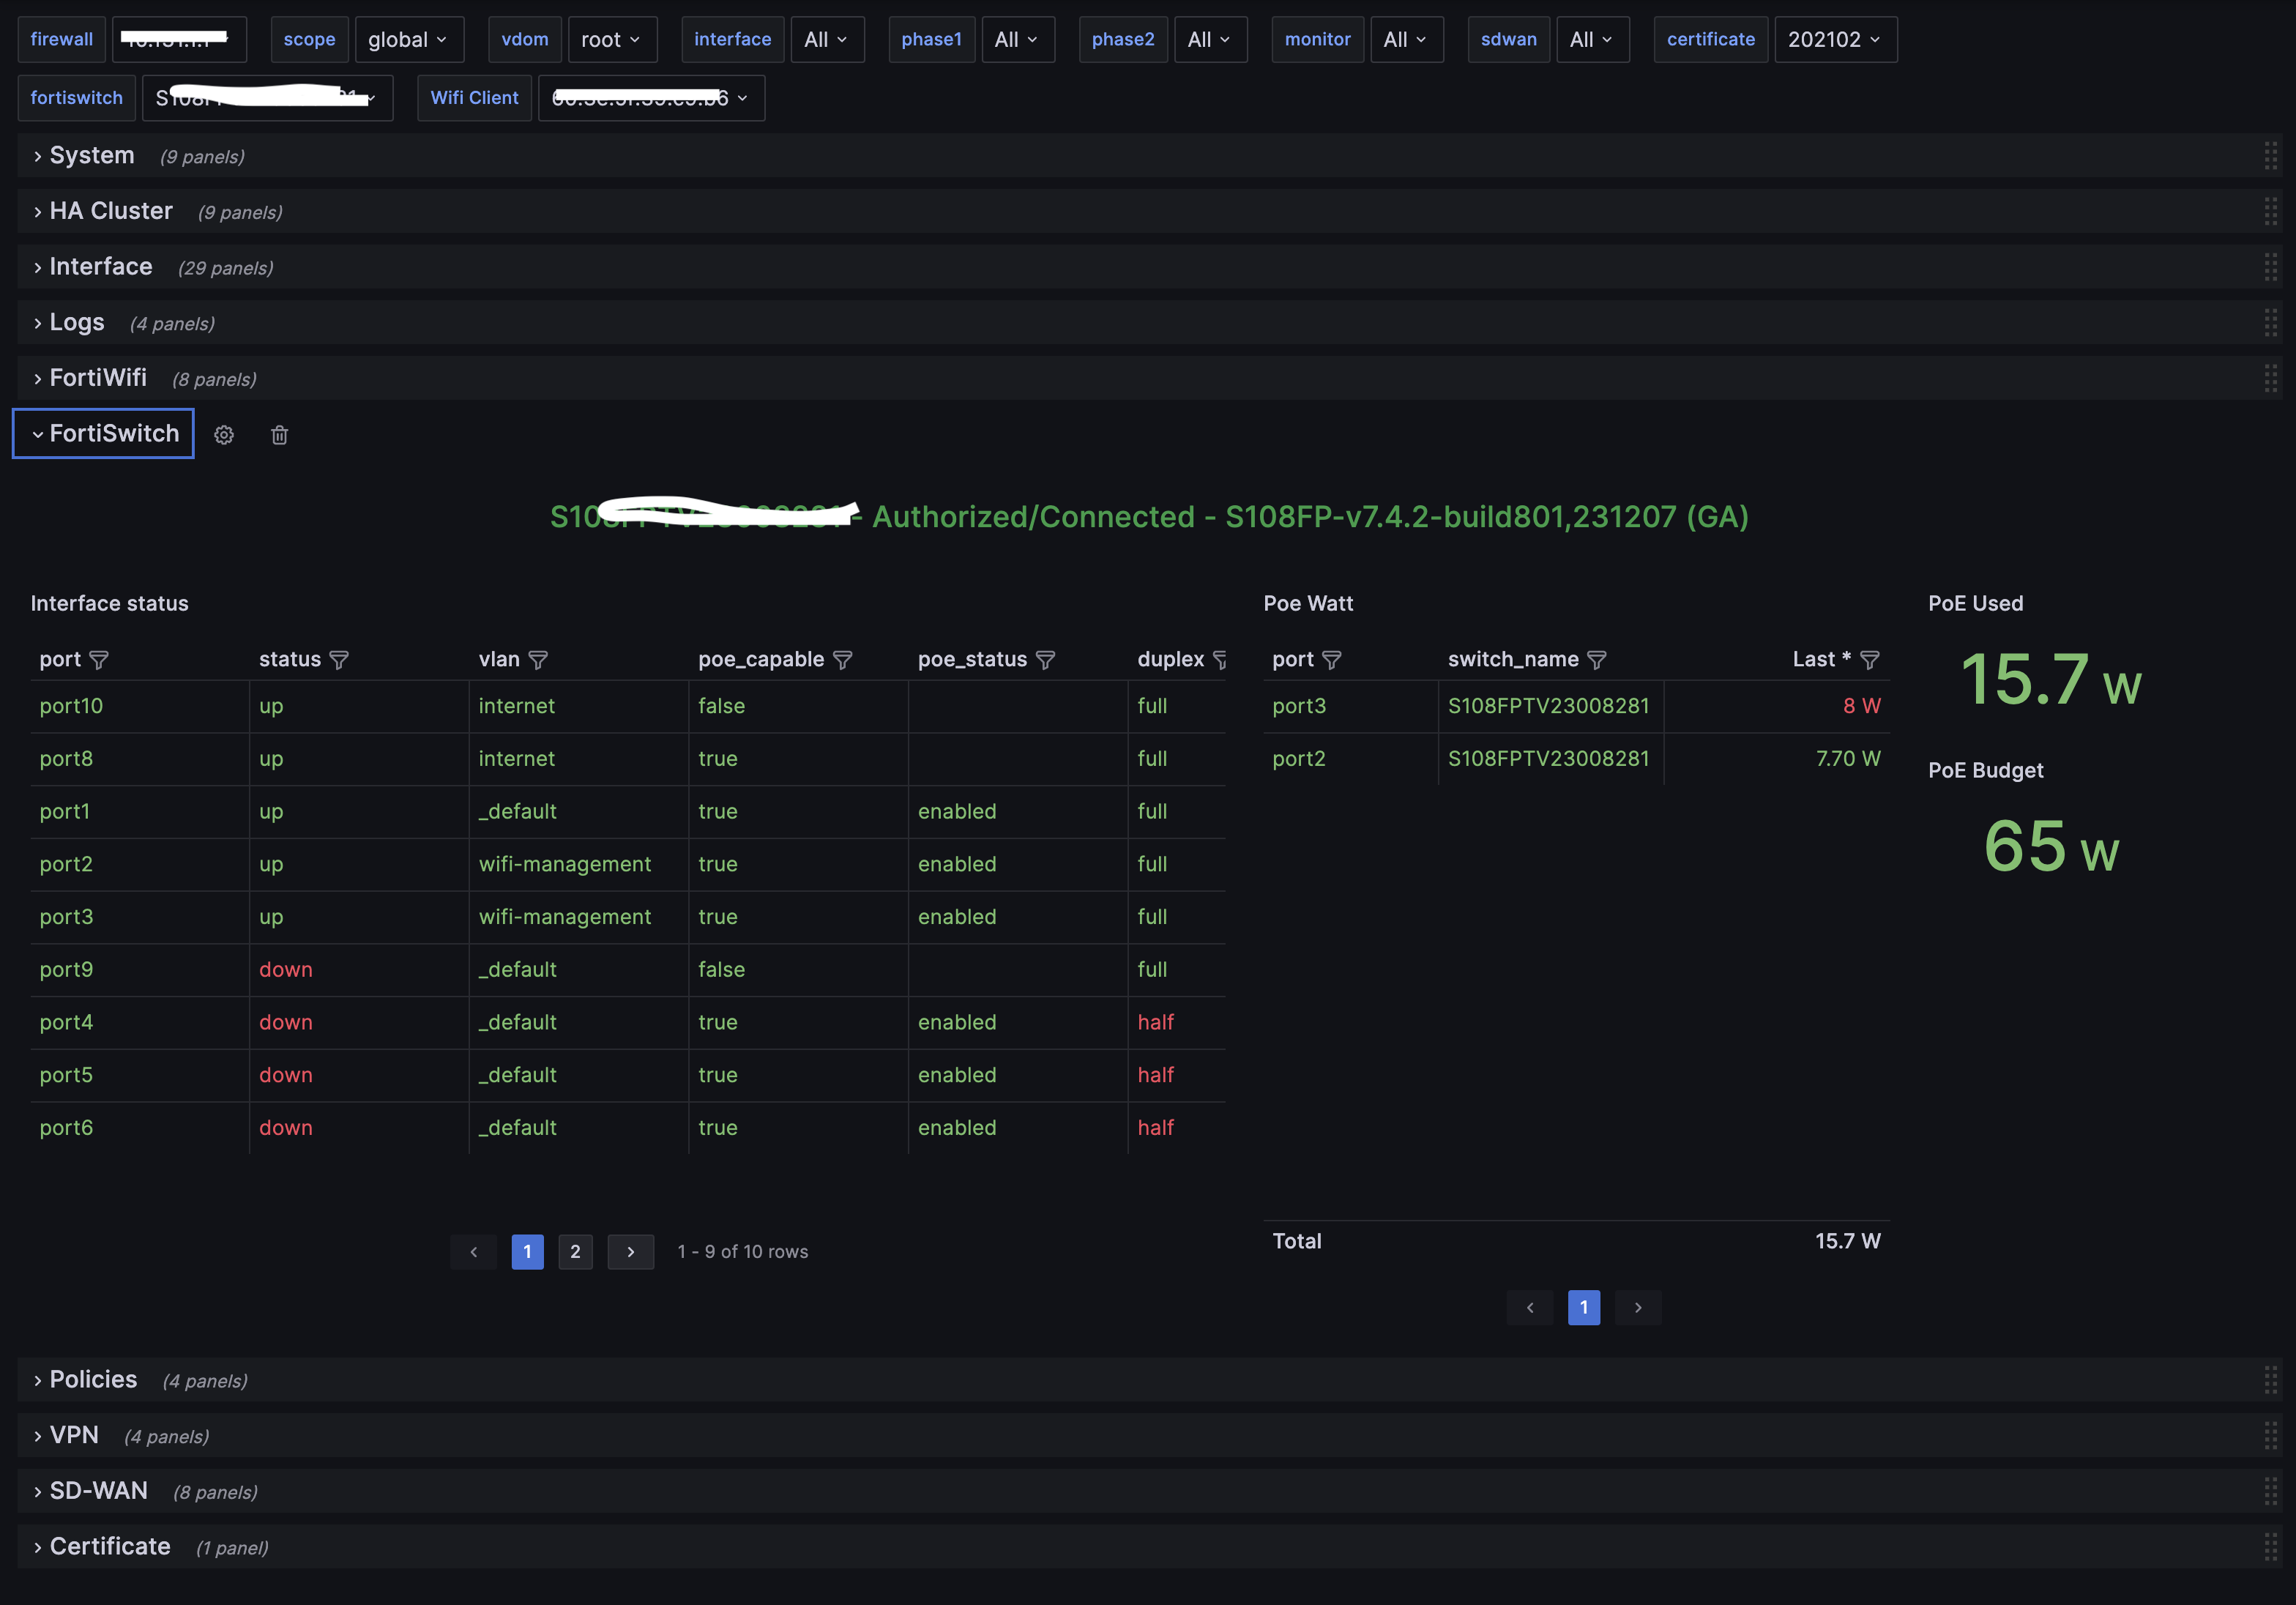
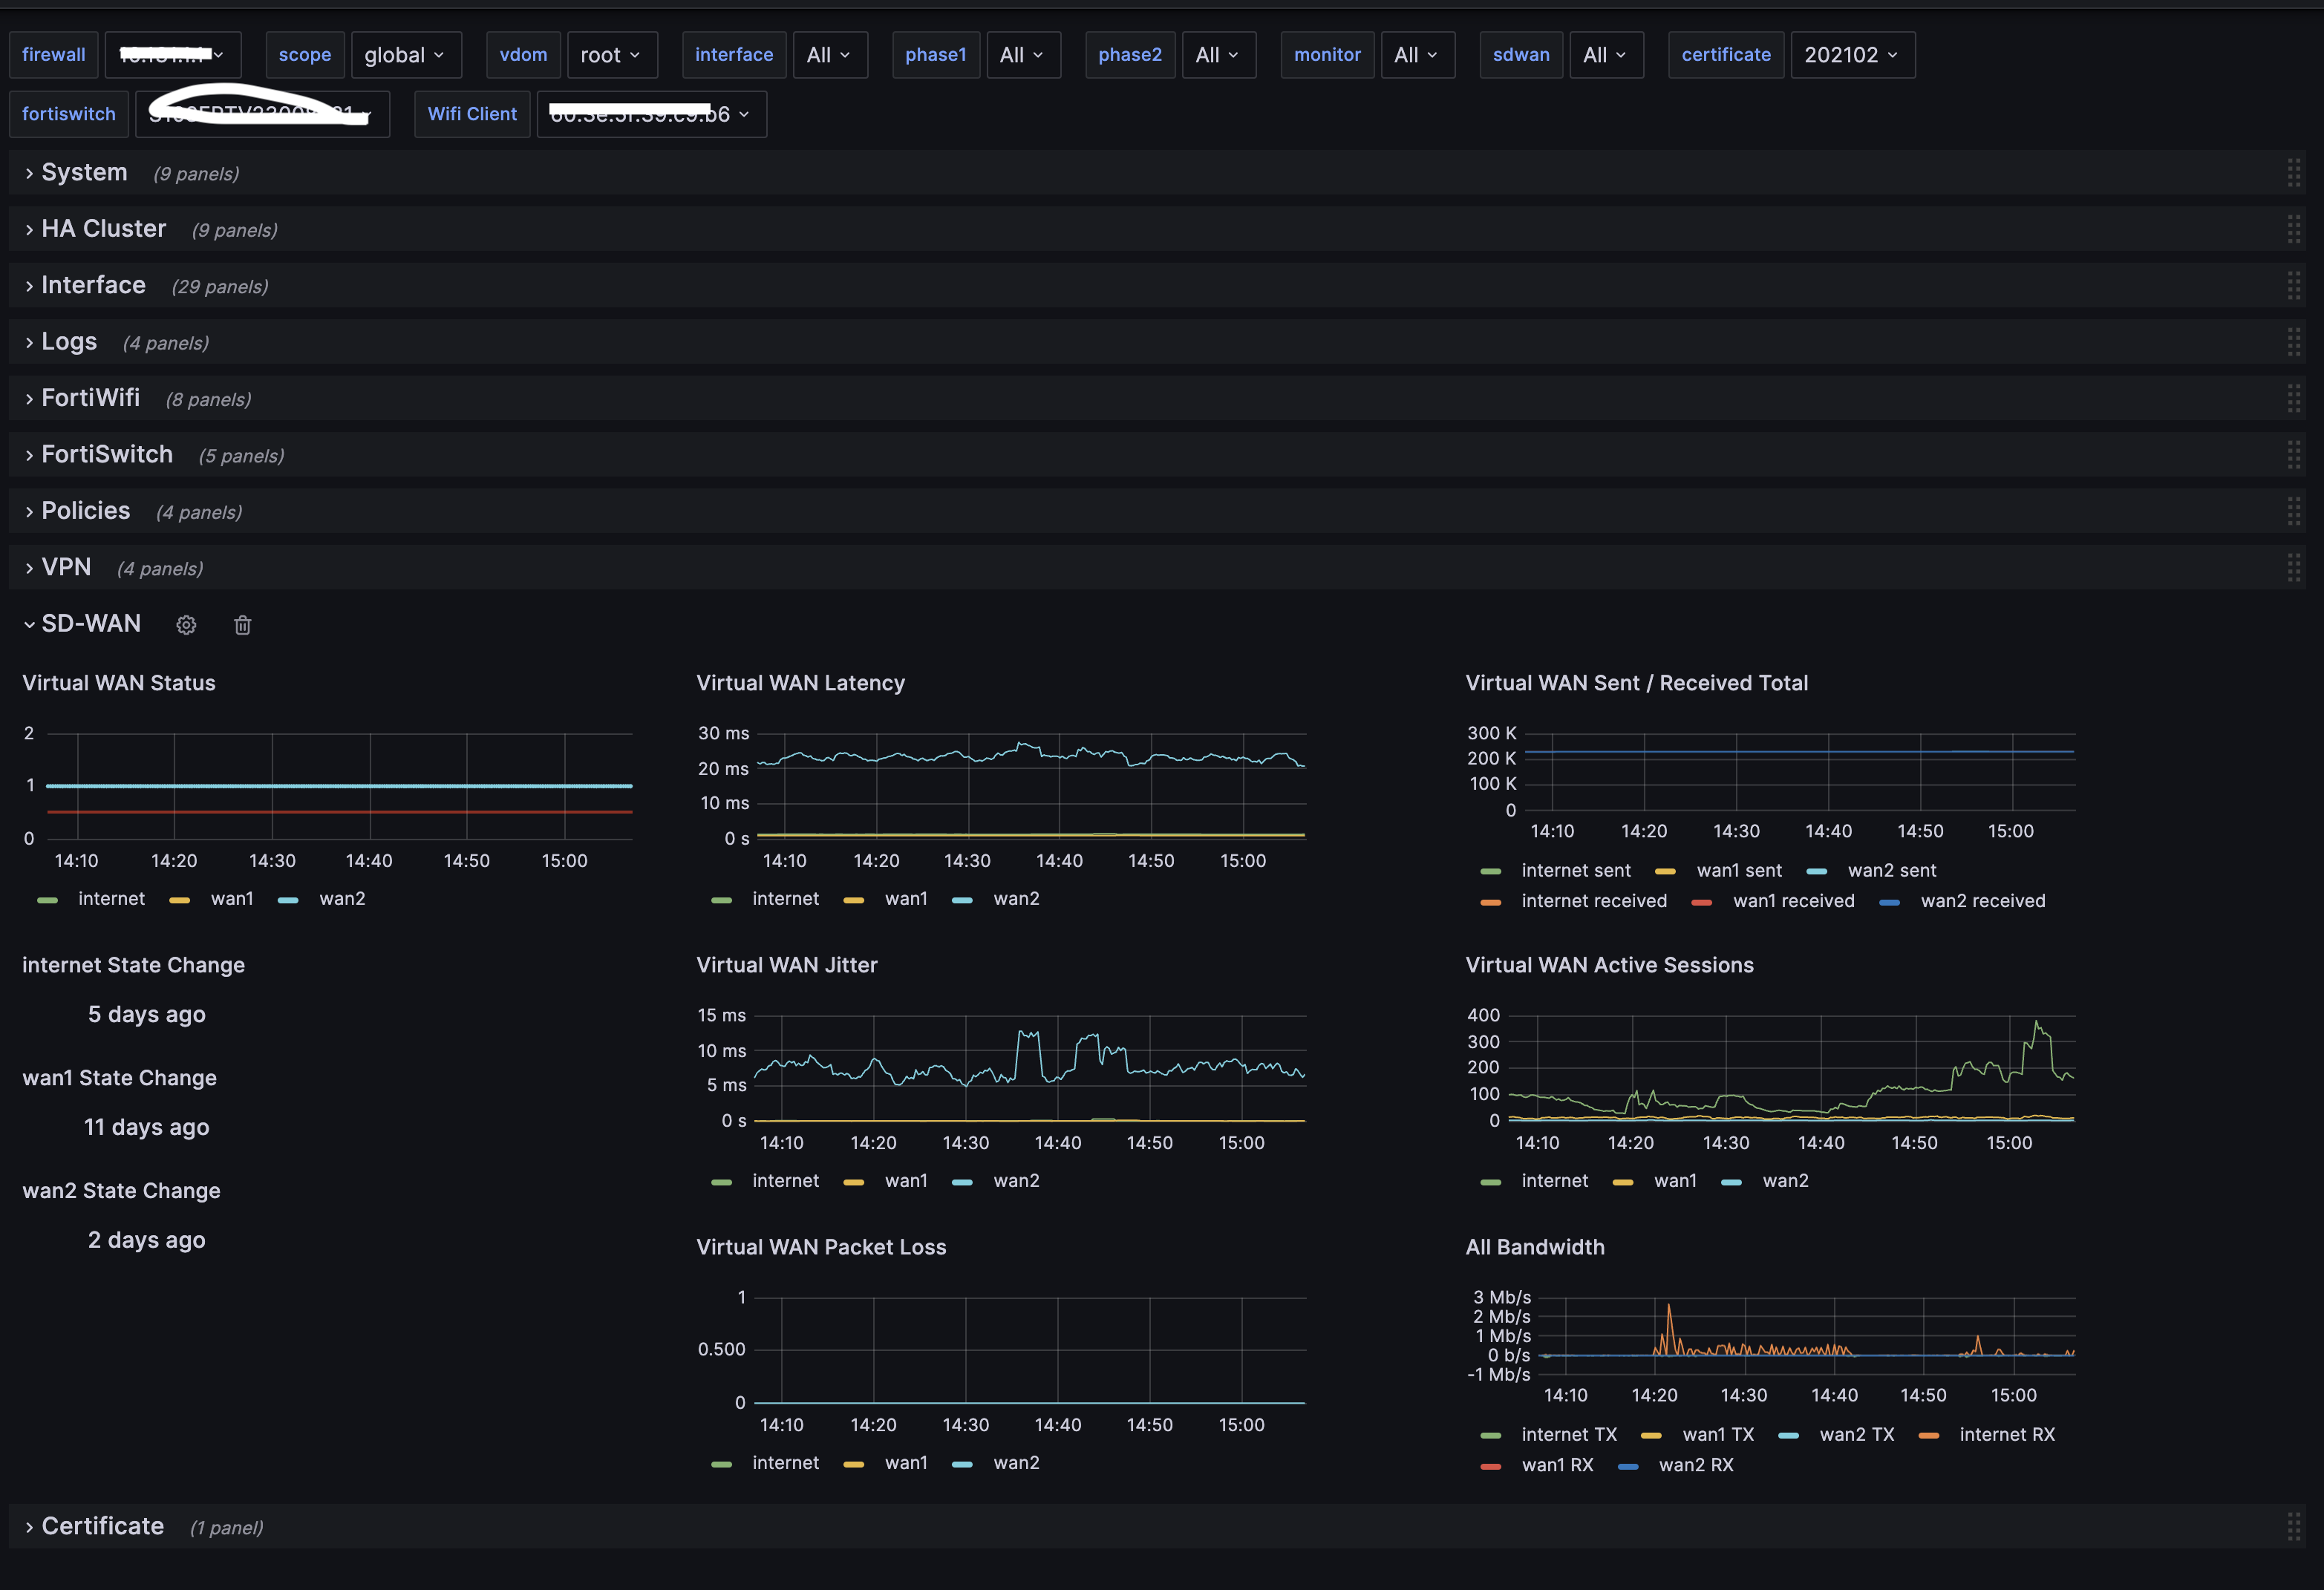
A Dashboard for the Prometheus fortigate_exporter
Screenshots
Used Metrics 99
fortigate_cpu_usage_ratio
fortigate_current_sessions
fortigate_last_reboot_seconds
fortigate_license_vdom_max
fortigate_license_vdom_usage
fortigate_memory_usage_ratio
fortigate_time_seconds
fortigate_version_info
fortigate_vpn_connections
Get Dashboard✕
Download
Copy to Clipboard