Fortigate Exporter 1,3381,338
8/28/2020
8/28/2020
1
>=7.1.5
Prometheus
Description
Graph CPU/Memory/Sessions/Interface traffic from Prometheus and the Fortigate Exporter
Screenshots
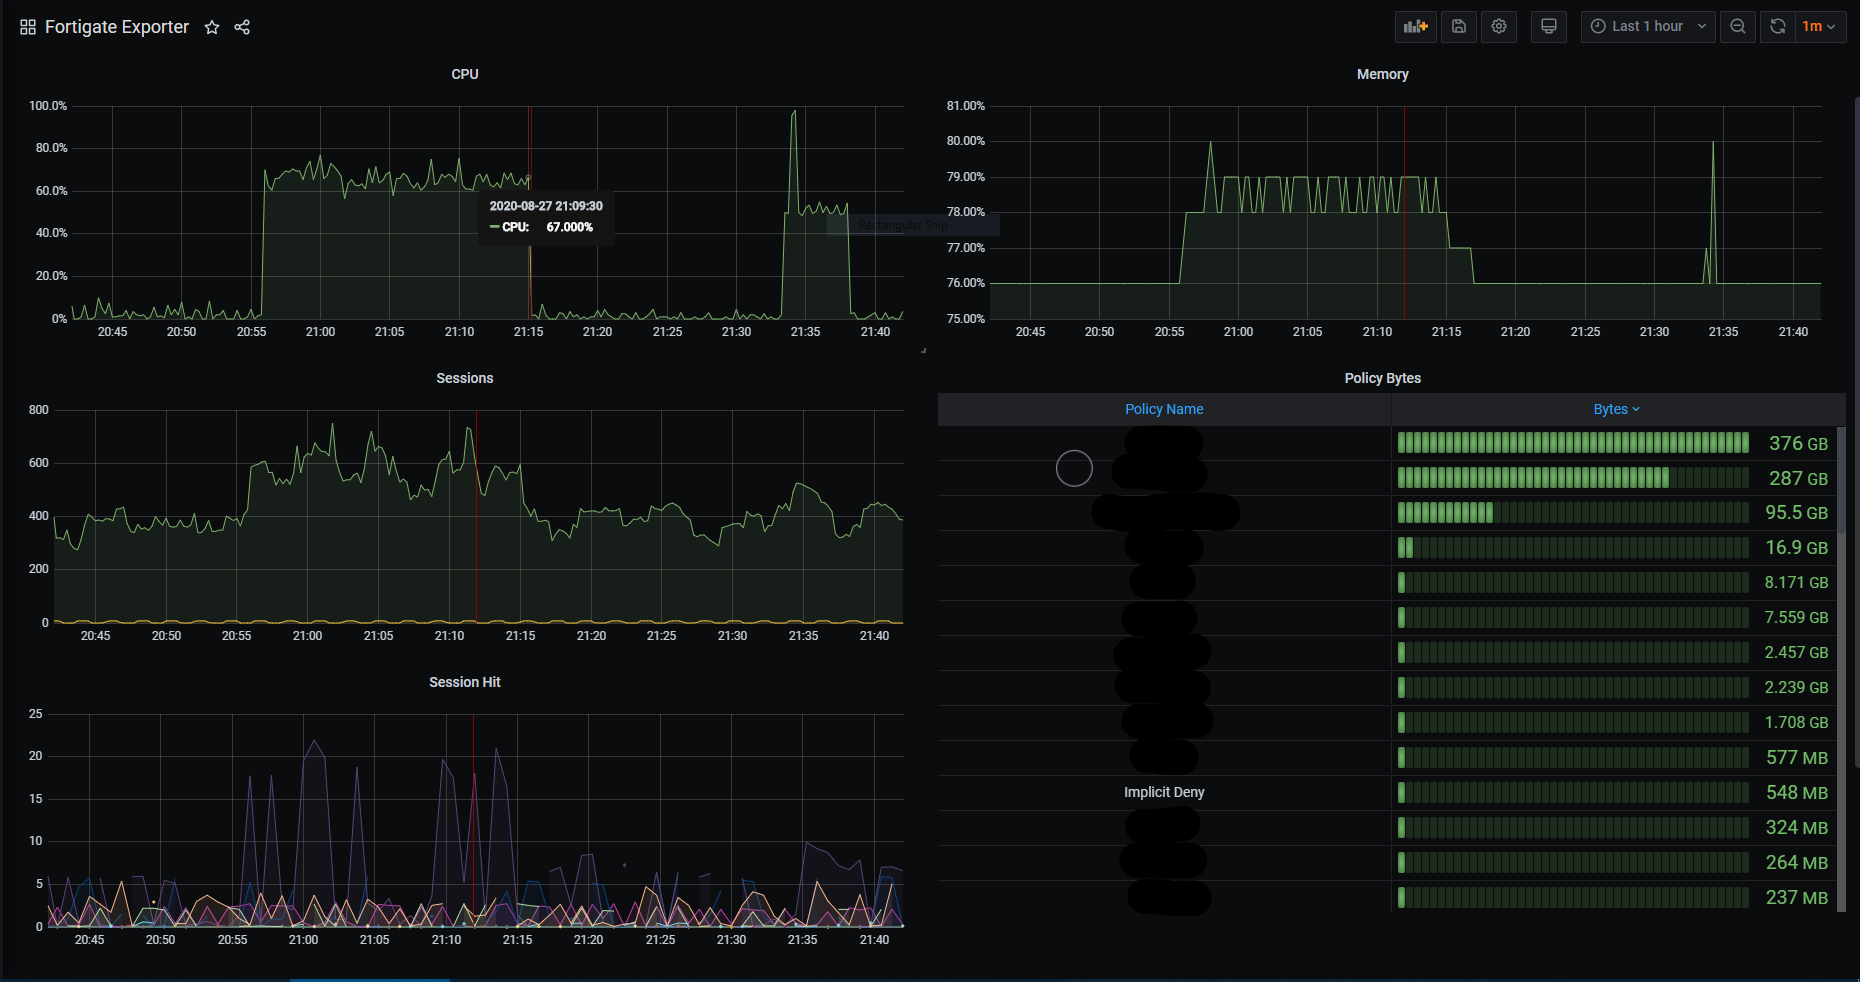
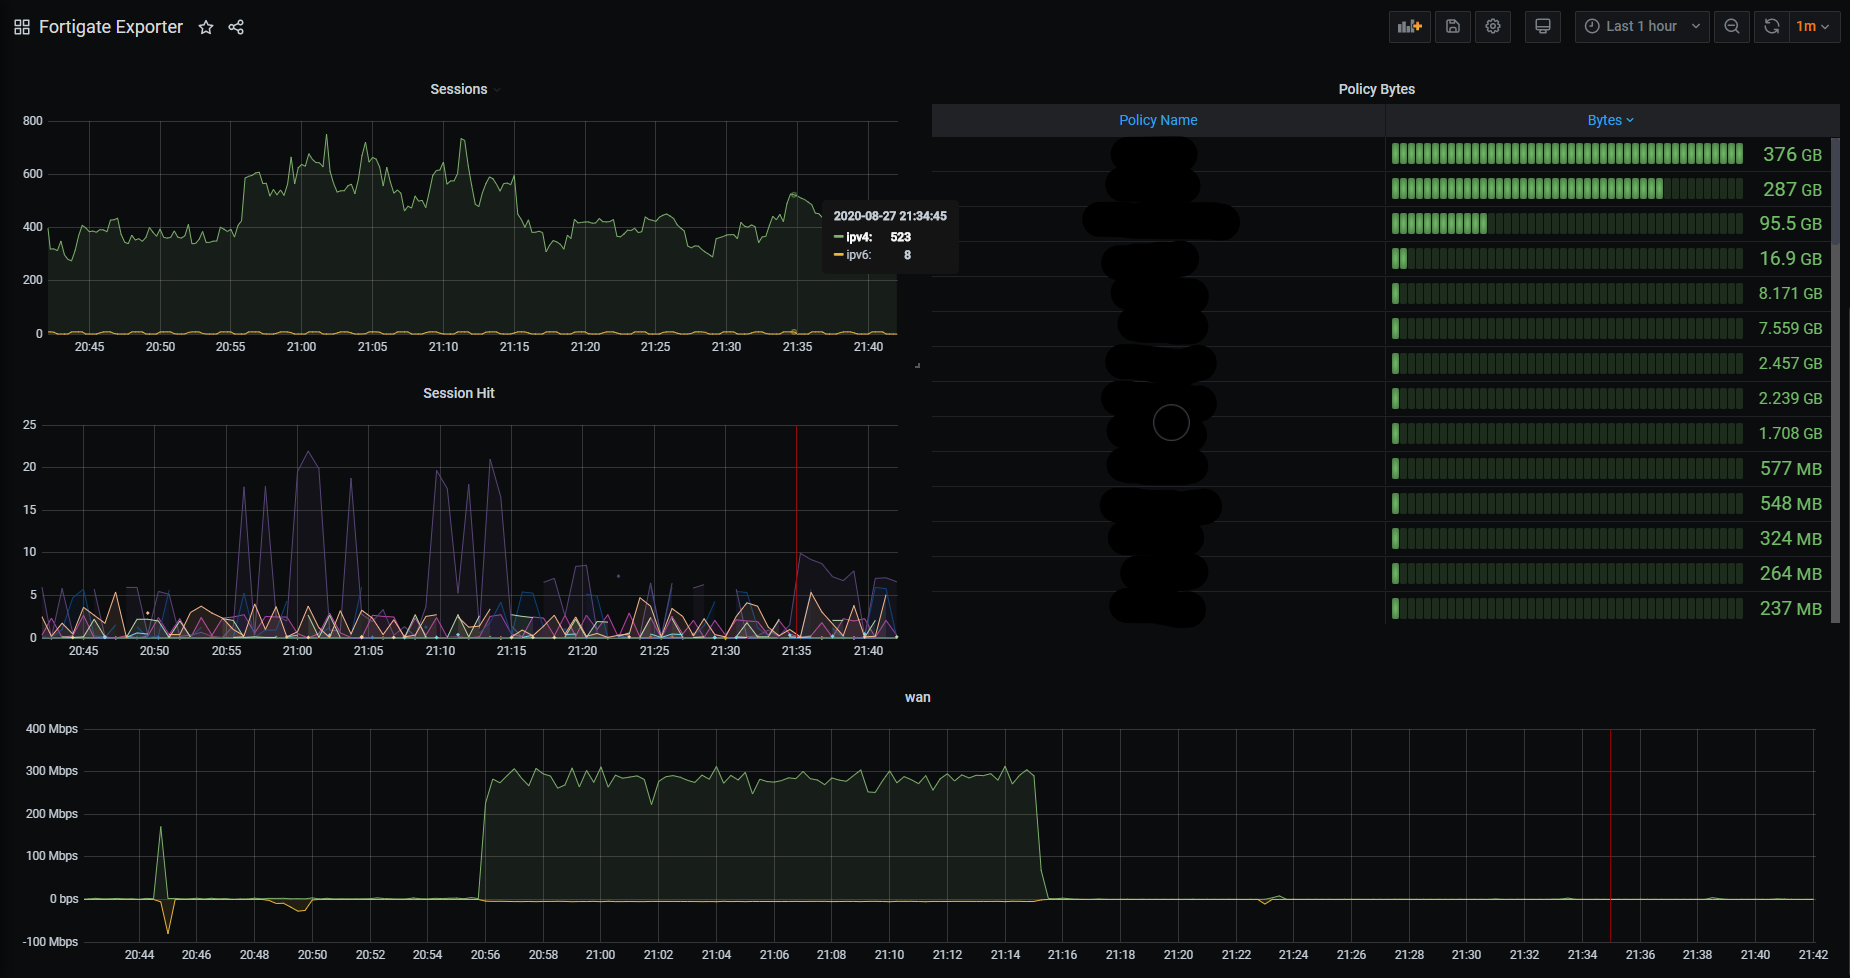
Used Metrics 88
fortigate_cpu_usage_ratio
fortigate_interface_receive_bytes_total
fortigate_interface_transmit_bytes_total
fortigate_memory_usage_ratio
fortigate_policy_active_sessions
fortigate_policy_bytes_total
fortigate_vdom_current_sessions
topk
Get Dashboard✕
Download
Copy to Clipboard