Flyte User Dashboard (via Prometheus) 6,0316,031
2/26/2021
4/3/2021
1
>=7.4.1
Prometheus
Description
Flyte User Dashboard. This is great to get a birds-eye and drill down view of executions in your Flyte cluster. Useful for the user.
Screenshots
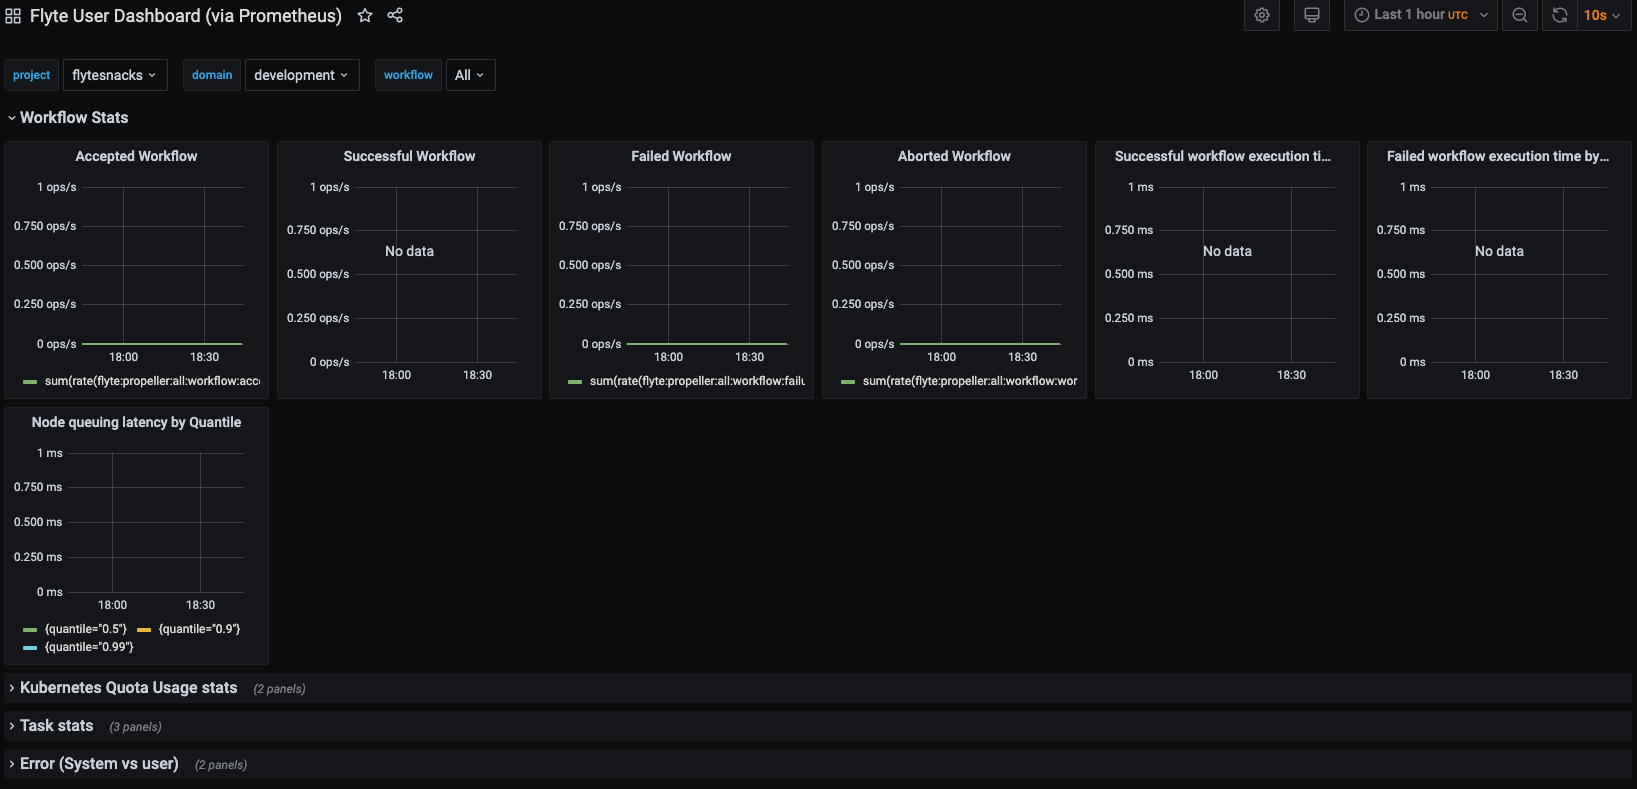
Used Metrics 77
flyte:propeller:all:node:queueing_latency_ms
flyte:propeller:all:workflow:accepted
flyte:propeller:all:workflow:failed_duration_ms
flyte:propeller:all:workflow:failure_duration_ms_count
flyte:propeller:all:workflow:success_duration_ms
flyte:propeller:all:workflow:success_duration_ms_count
flyte:propeller:all:workflow:workflow_aborted
Get Dashboard✕
Download
Copy to Clipboard