Flux2 2,139,2232,139,223 5.0 (2 reviews)
8/12/2022
8/12/2022
1
>=9.0.5
Prometheus
Description
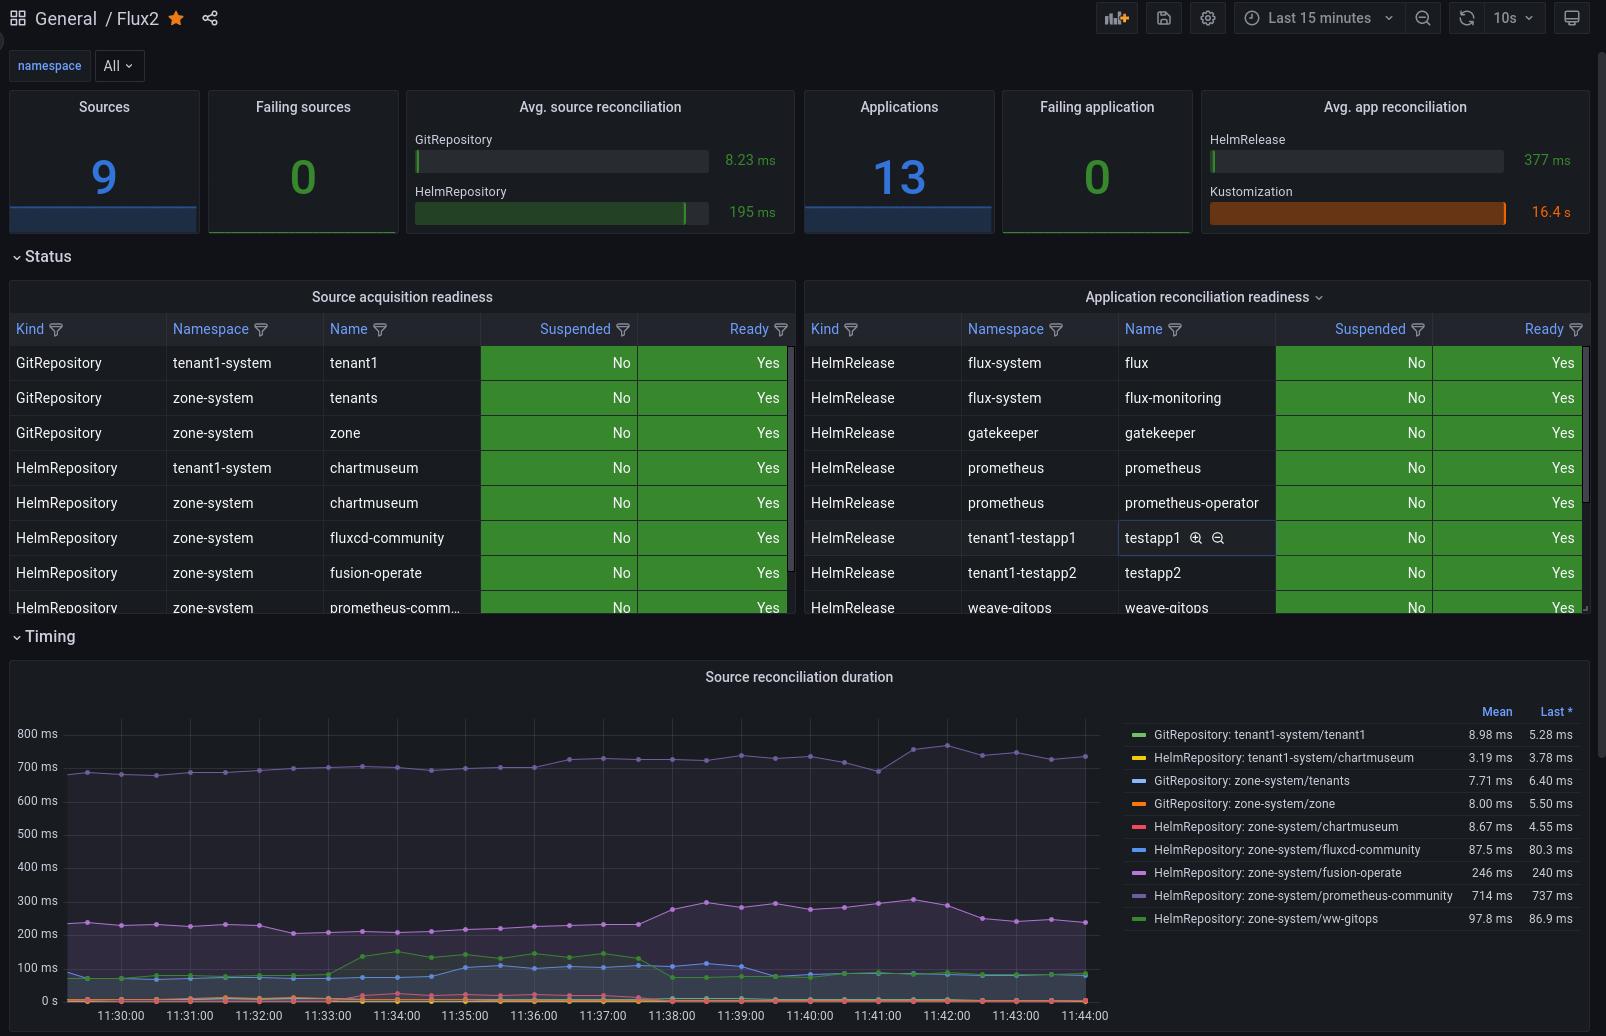
This dashboard monitors Flux source and application reconciliation processes, highlighting health and performance across both sources and applications. It emphasizes reconciliation outcomes and durations, typically using metrics like gotk_reconcile_condition, gotk_reconcile_duration_seconds_sum/_count, and identifiers such as name, namespace, and kind to distinguish components; panels include failing resources and readiness checks to surface issues quickly.
Screenshots
Used Metrics 88
exported_namespace
gotk_reconcile_condition
gotk_reconcile_duration_seconds_count
gotk_reconcile_duration_seconds_sum
gotk_suspend_status
join_key
kind
name
Get Dashboard✕
Download
Copy to Clipboard