FlareSolverr 1,7621,762
8/17/2023
8/27/2023
1
Docker
>=10.0.3
Prometheus
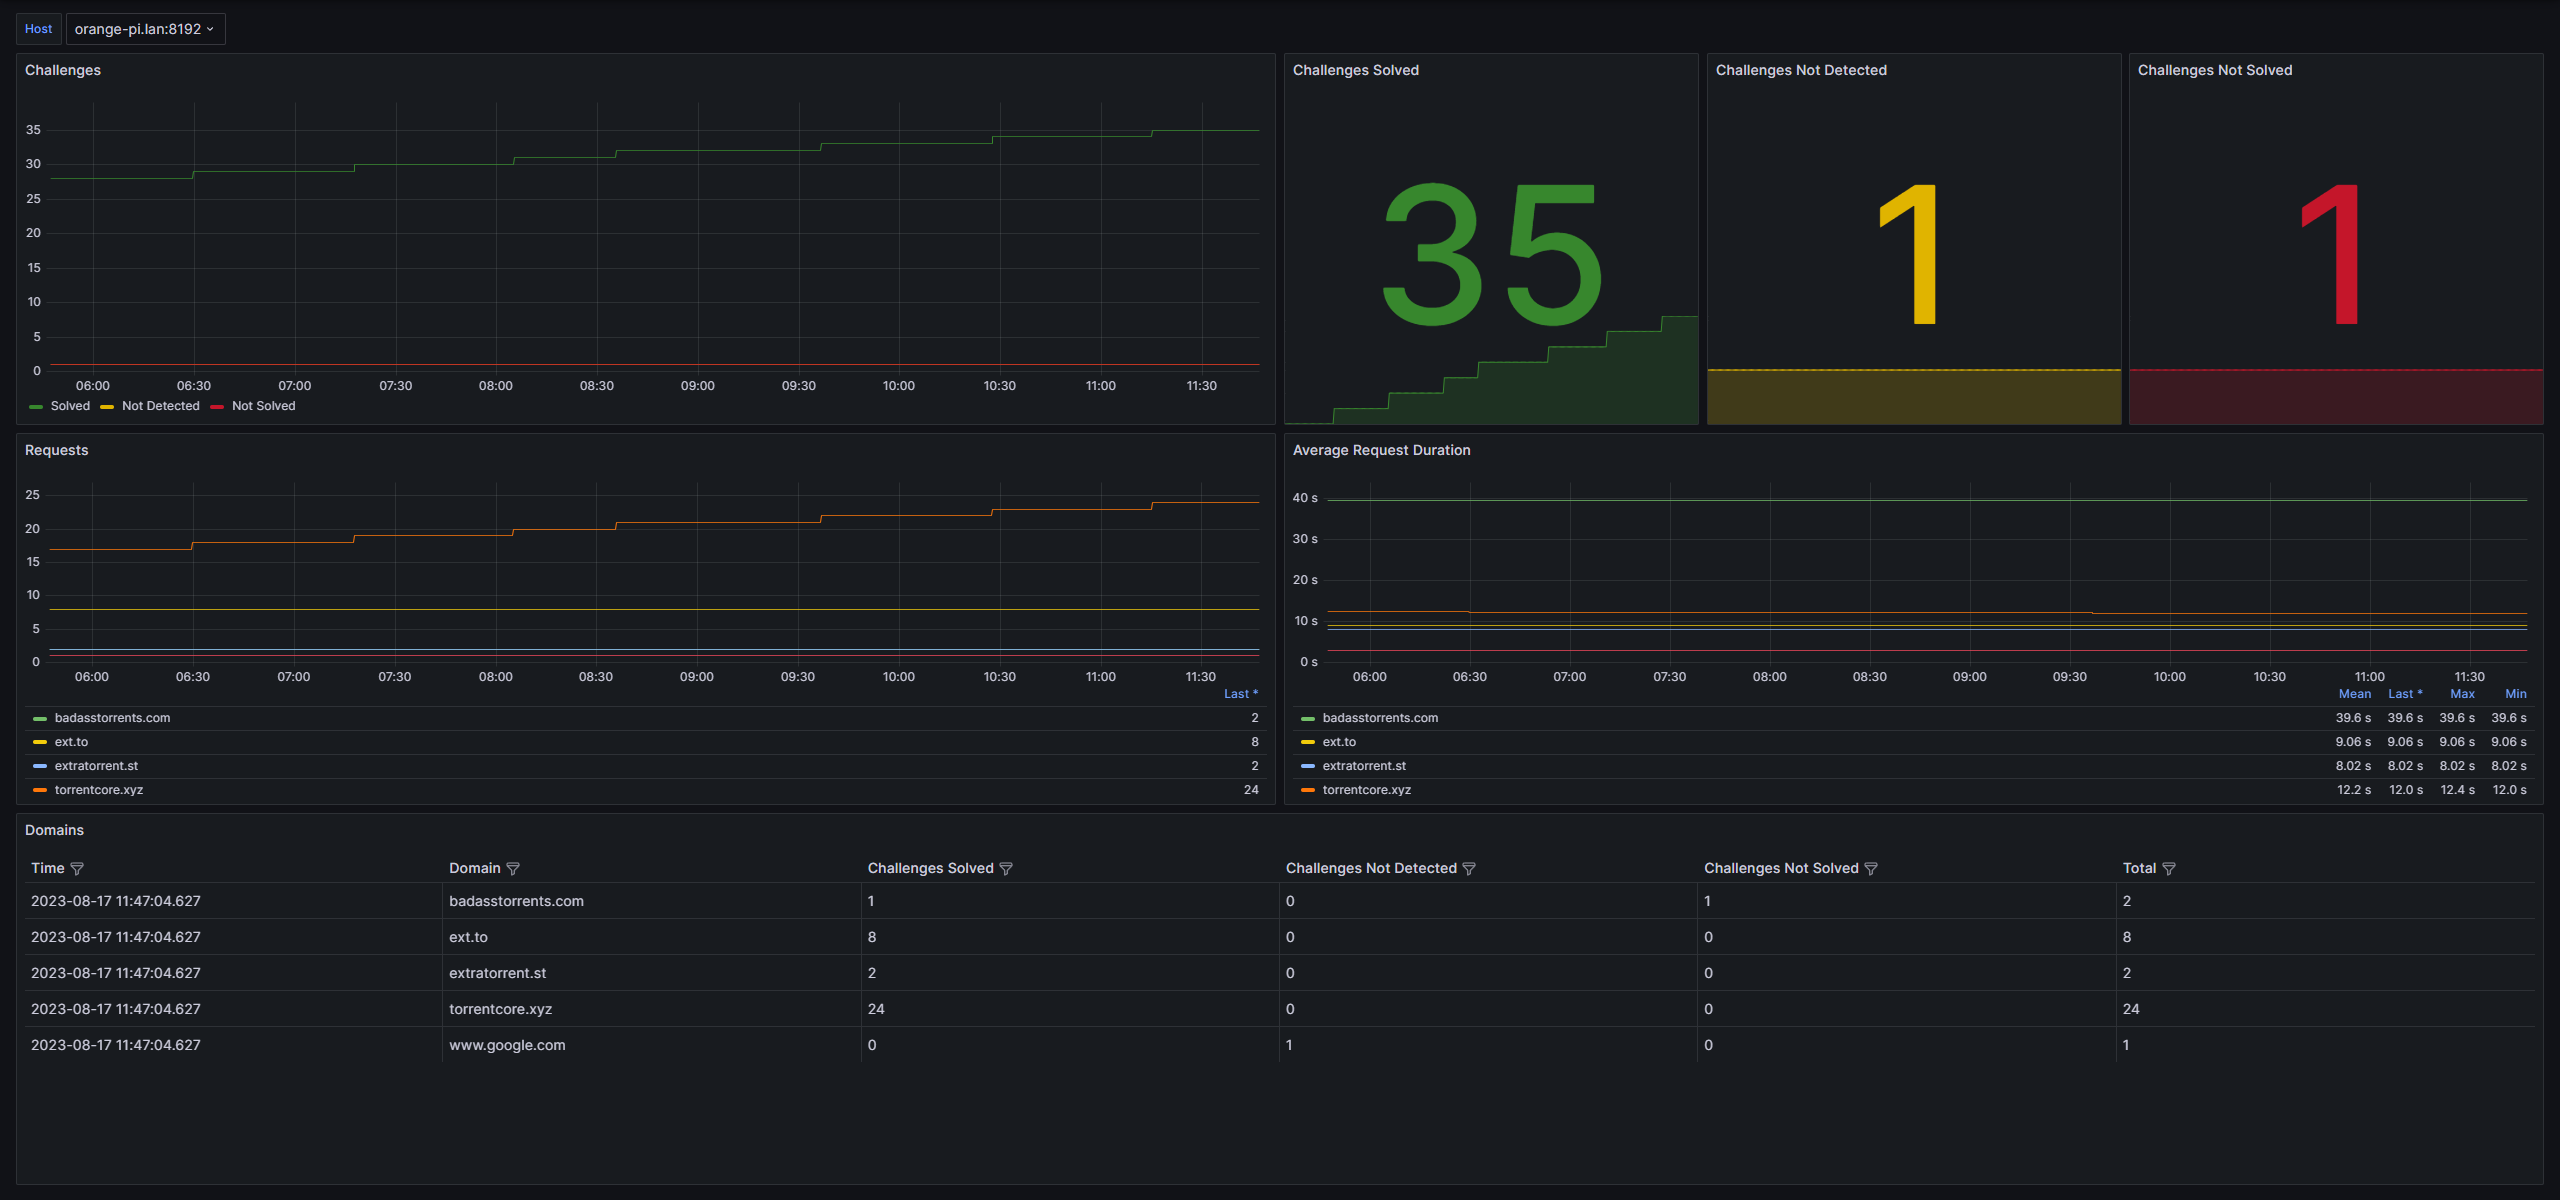
Description
A dashboard for the FlareSolverr Prometheus exporter: https://github.com/FlareSolverr/FlareSolverr
Screenshots
Used Metrics 33
flaresolverr_request_duration_count
flaresolverr_request_duration_sum
flaresolverr_request_total
Get Dashboard✕
Download
Copy to Clipboard