Filebeat 37,45737,457
Description
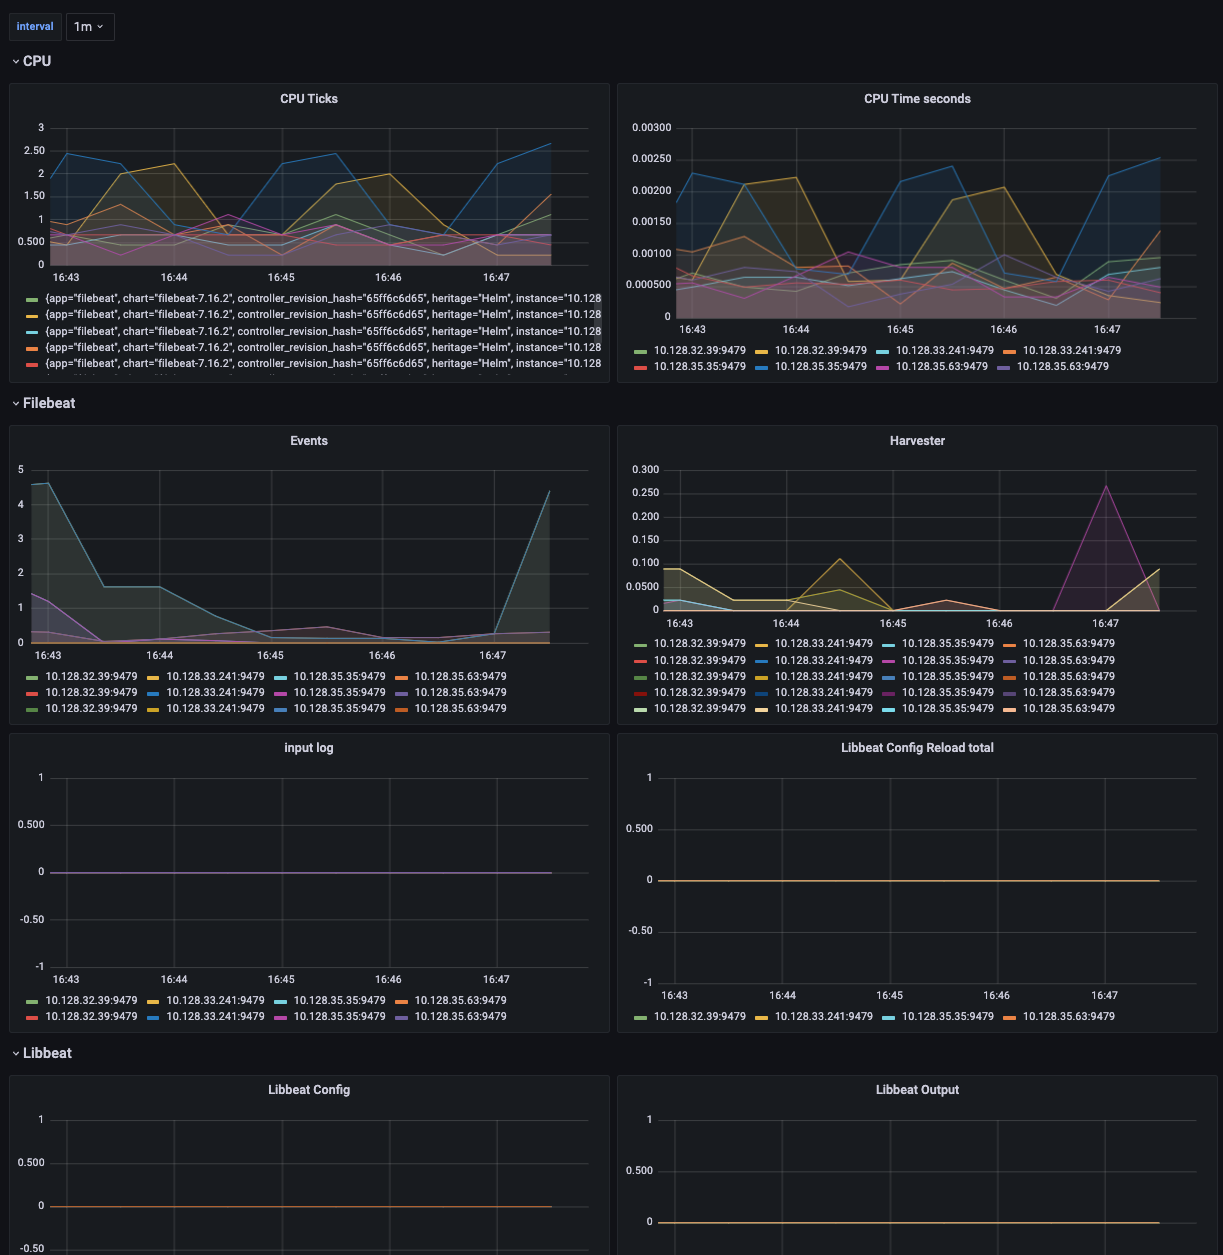
Dashboard for Filebeat metrics from Prometheus. Requires https://github.com/trustpilot/beat-exporter
Screenshots
Used Metrics 2727
filebeat_auditd_kernel_lost
filebeat_auditd_reassembler_seq_gaps
filebeat_auditd_received_msgs
filebeat_auditd_userspace_lost
filebeat_cpu_ticks_total
filebeat_cpu_time_seconds_total
filebeat_filebeat_events
filebeat_filebeat_harvester
filebeat_filebeat_input_log
filebeat_libbeat_config
filebeat_libbeat_config_reloads_total
filebeat_libbeat_output_events
filebeat_libbeat_output_read_bytes_total
filebeat_libbeat_output_read_errors_total
filebeat_libbeat_output_total
filebeat_libbeat_output_write_bytes_total
filebeat_libbeat_output_write_errors_total
filebeat_libbeat_pipeline_clients
filebeat_libbeat_pipeline_events
filebeat_libbeat_pipeline_queue
filebeat_memstats_gc_next_total
filebeat_memstats_memory
filebeat_memstats_memory_alloc
filebeat_memstats_rss
filebeat_registrar_states
filebeat_registrar_writes
interval