FastStream Metrics 1,4311,431
10/20/2024
10/21/2024
3
>=7.0.1
Prometheus
Description
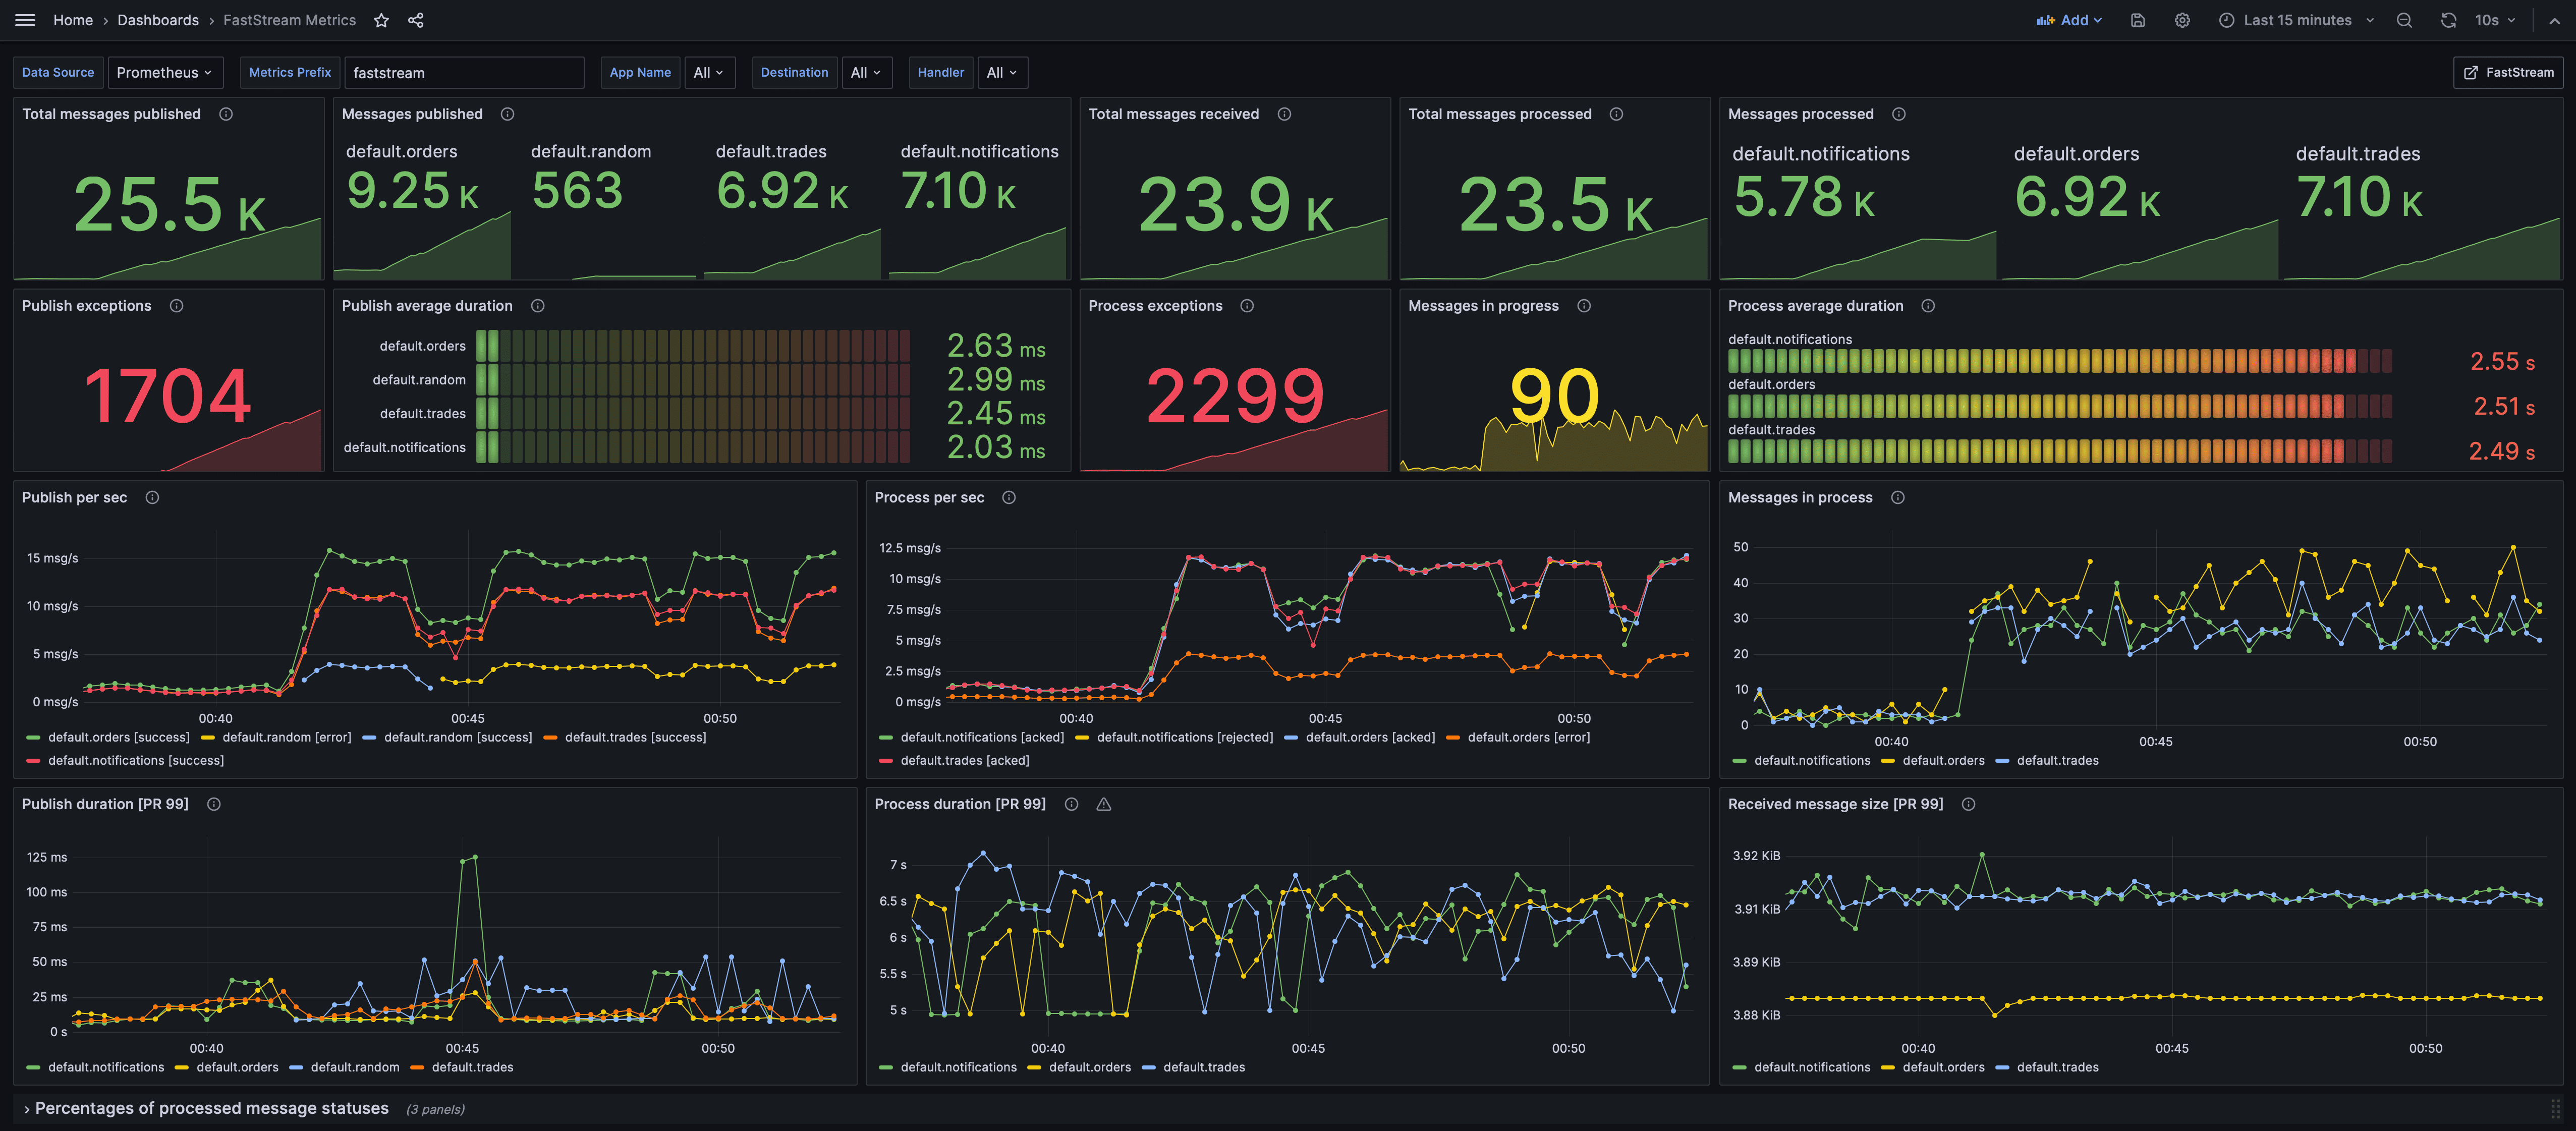
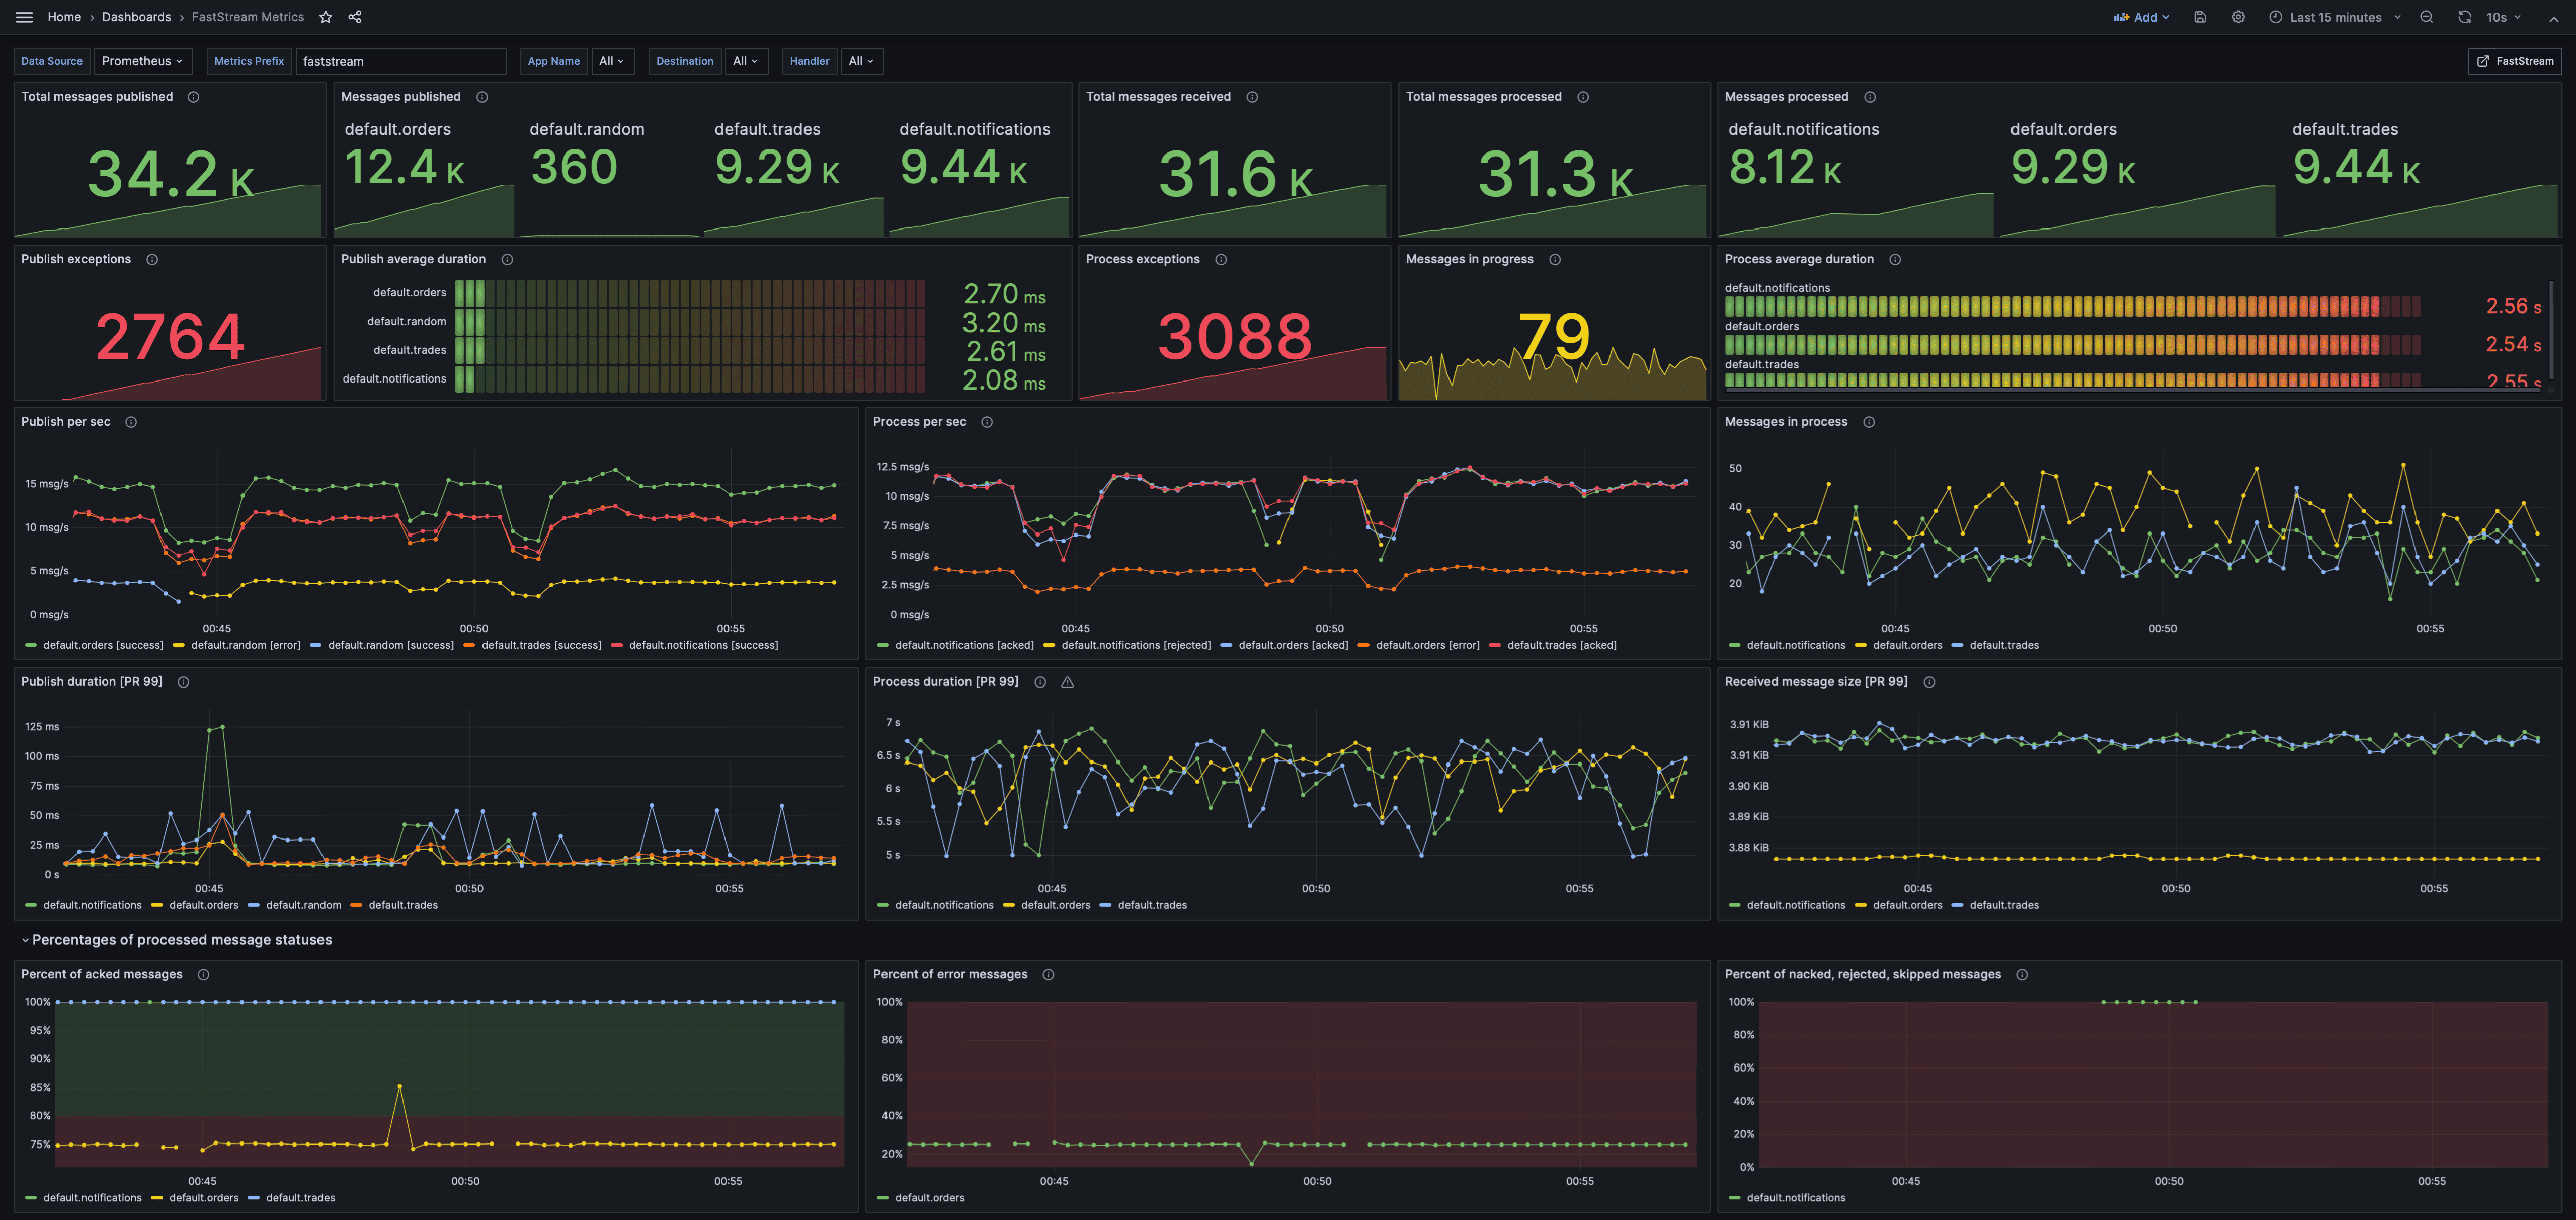
FastStream is a powerful and easy-to-use Python framework for building asynchronous services interacting with event streams such as Apache Kafka, RabbitMQ, NATS and Redis
Screenshots
Used Metrics 1818
_published_messages_duration_seconds_bucket
_published_messages_duration_seconds_count
_published_messages_duration_seconds_sum
_published_messages_exceptions_total
_published_messages_total
_received_messages_in_process
_received_messages_size_bytes_bucket
_received_messages_total
_received_processed_messages_duration_seconds_bucket
_received_processed_messages_duration_seconds_count
_received_processed_messages_duration_seconds_sum
_received_processed_messages_exceptions_total
_received_processed_messages_total
acked
destination
handler
status
success
Get Dashboard✕
Download
Copy to Clipboard