FastAPI Observability 52,21352,213
Description
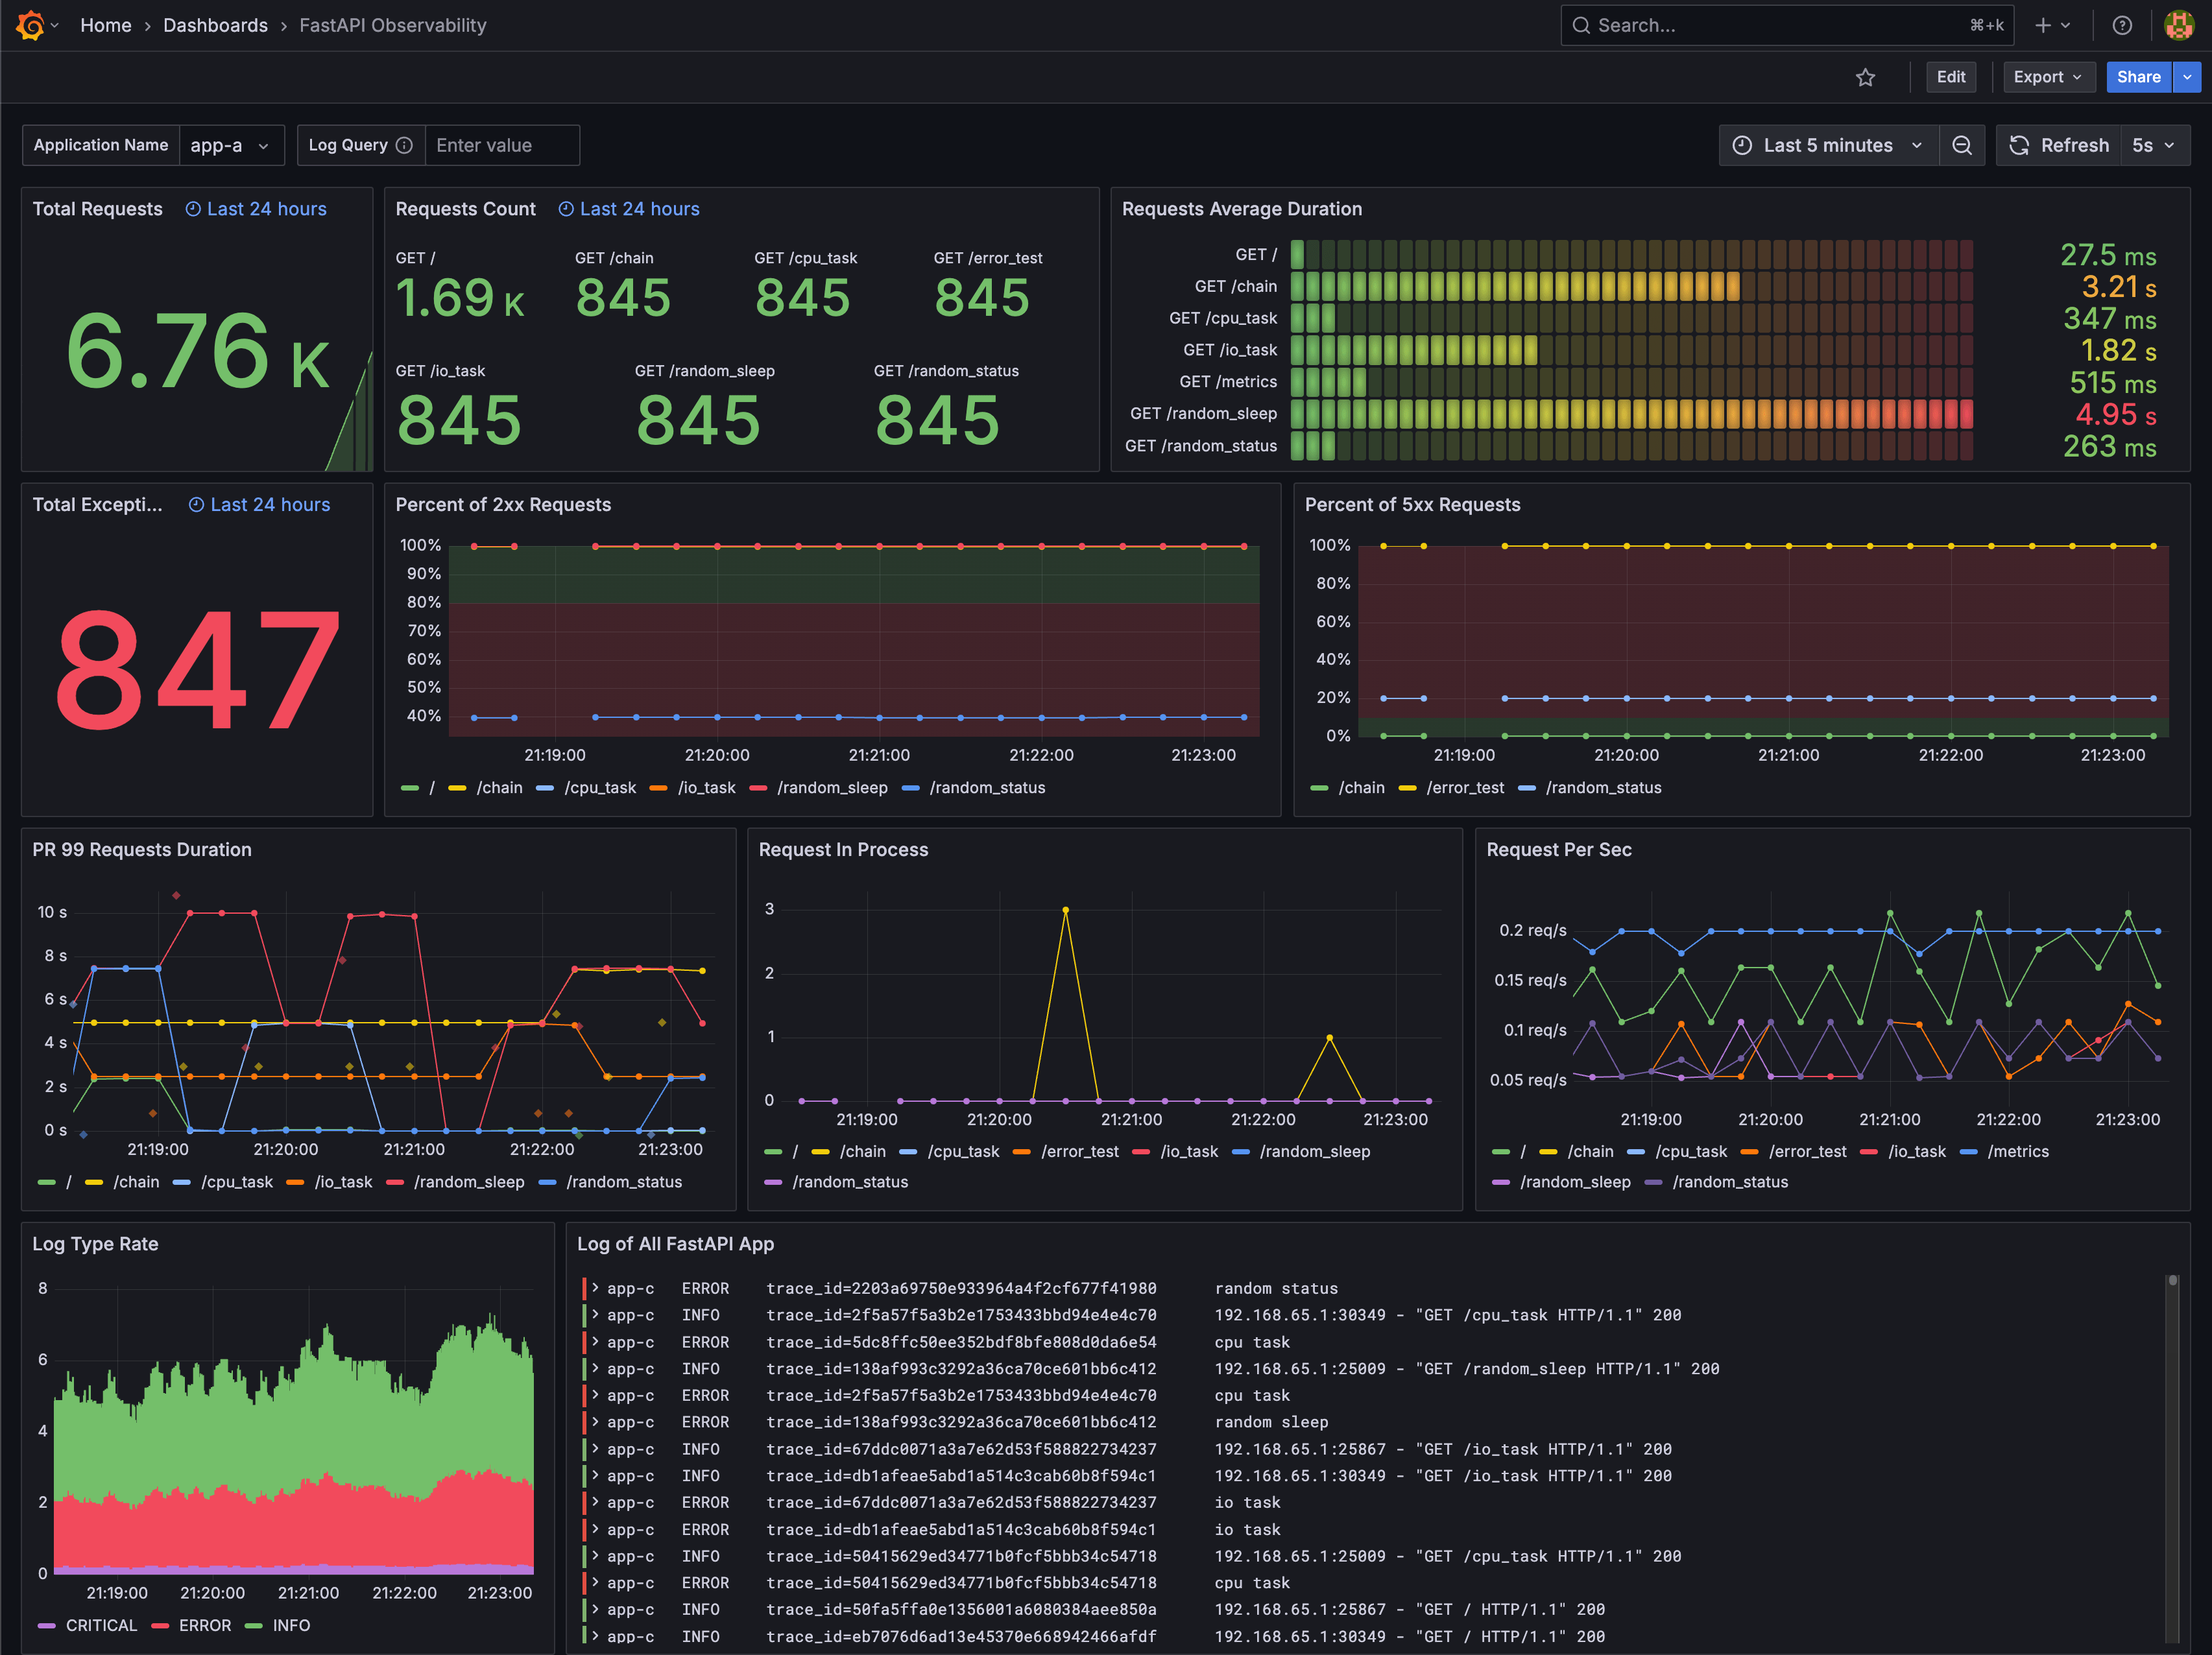
This dashboard monitors FastAPI application health and performance, aggregating request throughput, latency, and error rates with a focus on response quality and lifecycle. It highlights key metrics like fastapi_requests_total (total requests), fastapi_requests_duration_seconds_count and fastapi_requests_duration_seconds_sum (latency distribution and mean duration), and fastapi_exceptions_total (errors) to track request success rate, average duration, and exception frequency, while panels such as PR 99 Requests Duration and Request In Process provide deeper insights into percentile latency and in-flight requests. It also surfaces log-based context with pattern, date, and type to support rapid diagnosis of issues across different log types.
Screenshots
Used Metrics 2020
_
code
date
fastapi_exceptions_total
fastapi_requests_duration_seconds_bucket
fastapi_requests_duration_seconds_count
fastapi_requests_duration_seconds_sum
fastapi_requests_in_progress
fastapi_requests_total
fastapi_responses_total
line_format
log_keyword
logger
msg
pattern
service_name
span_id
t
trace_id
type