F5 BIG-IP Dashboard 1,0191,019
Description
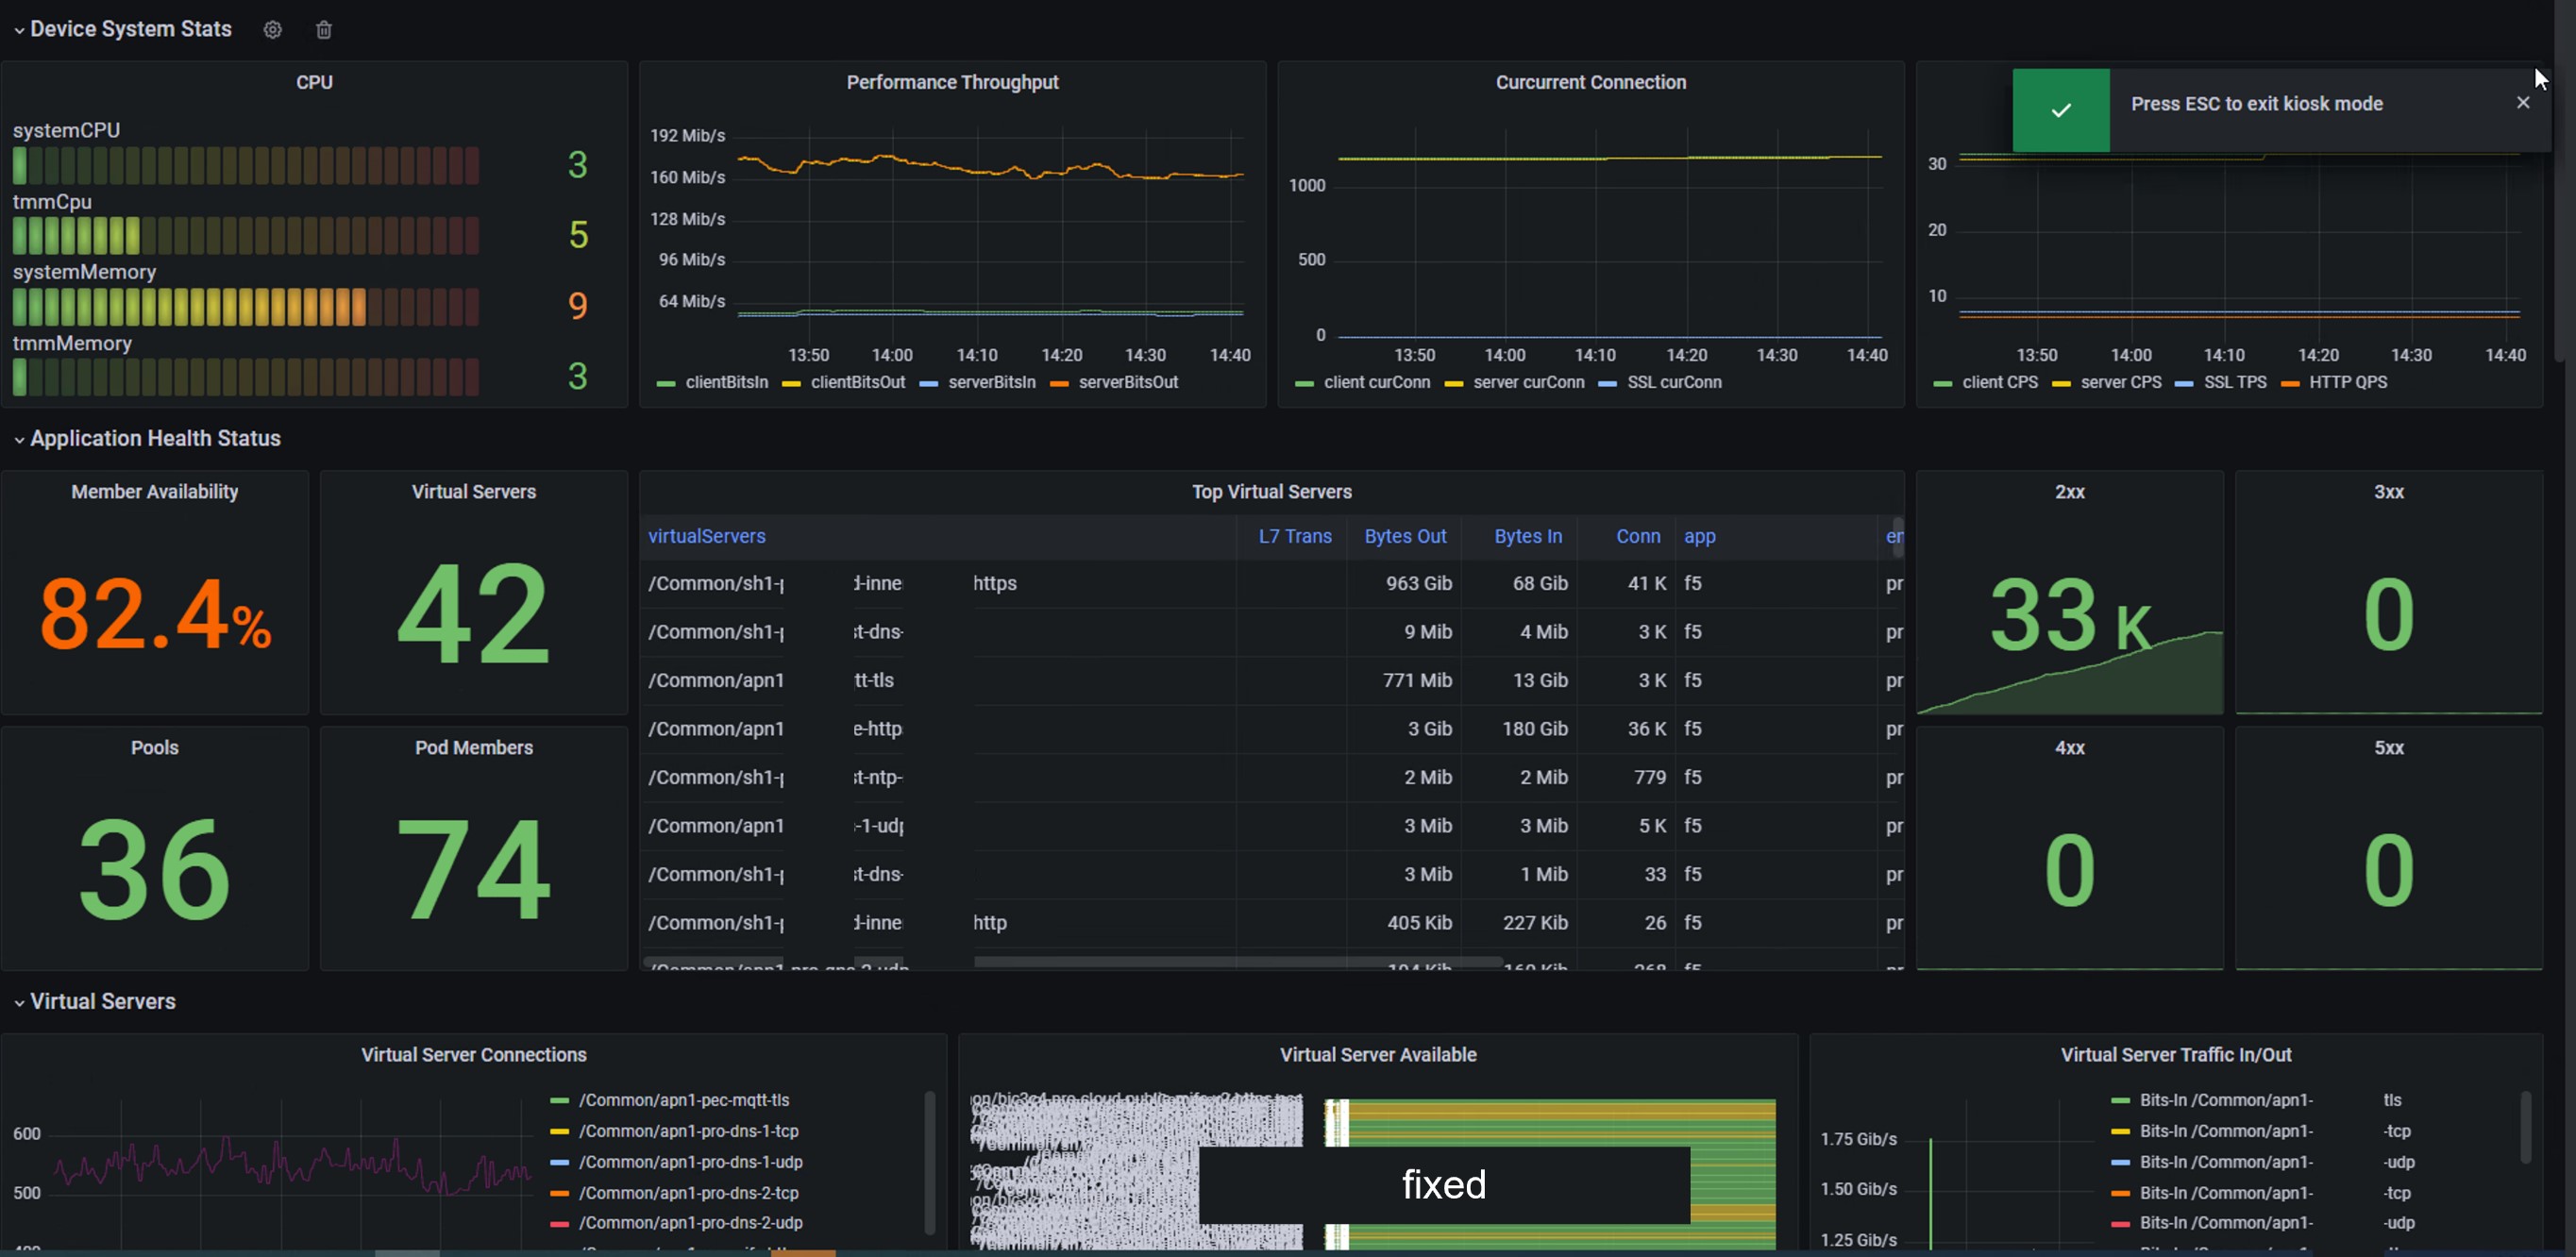
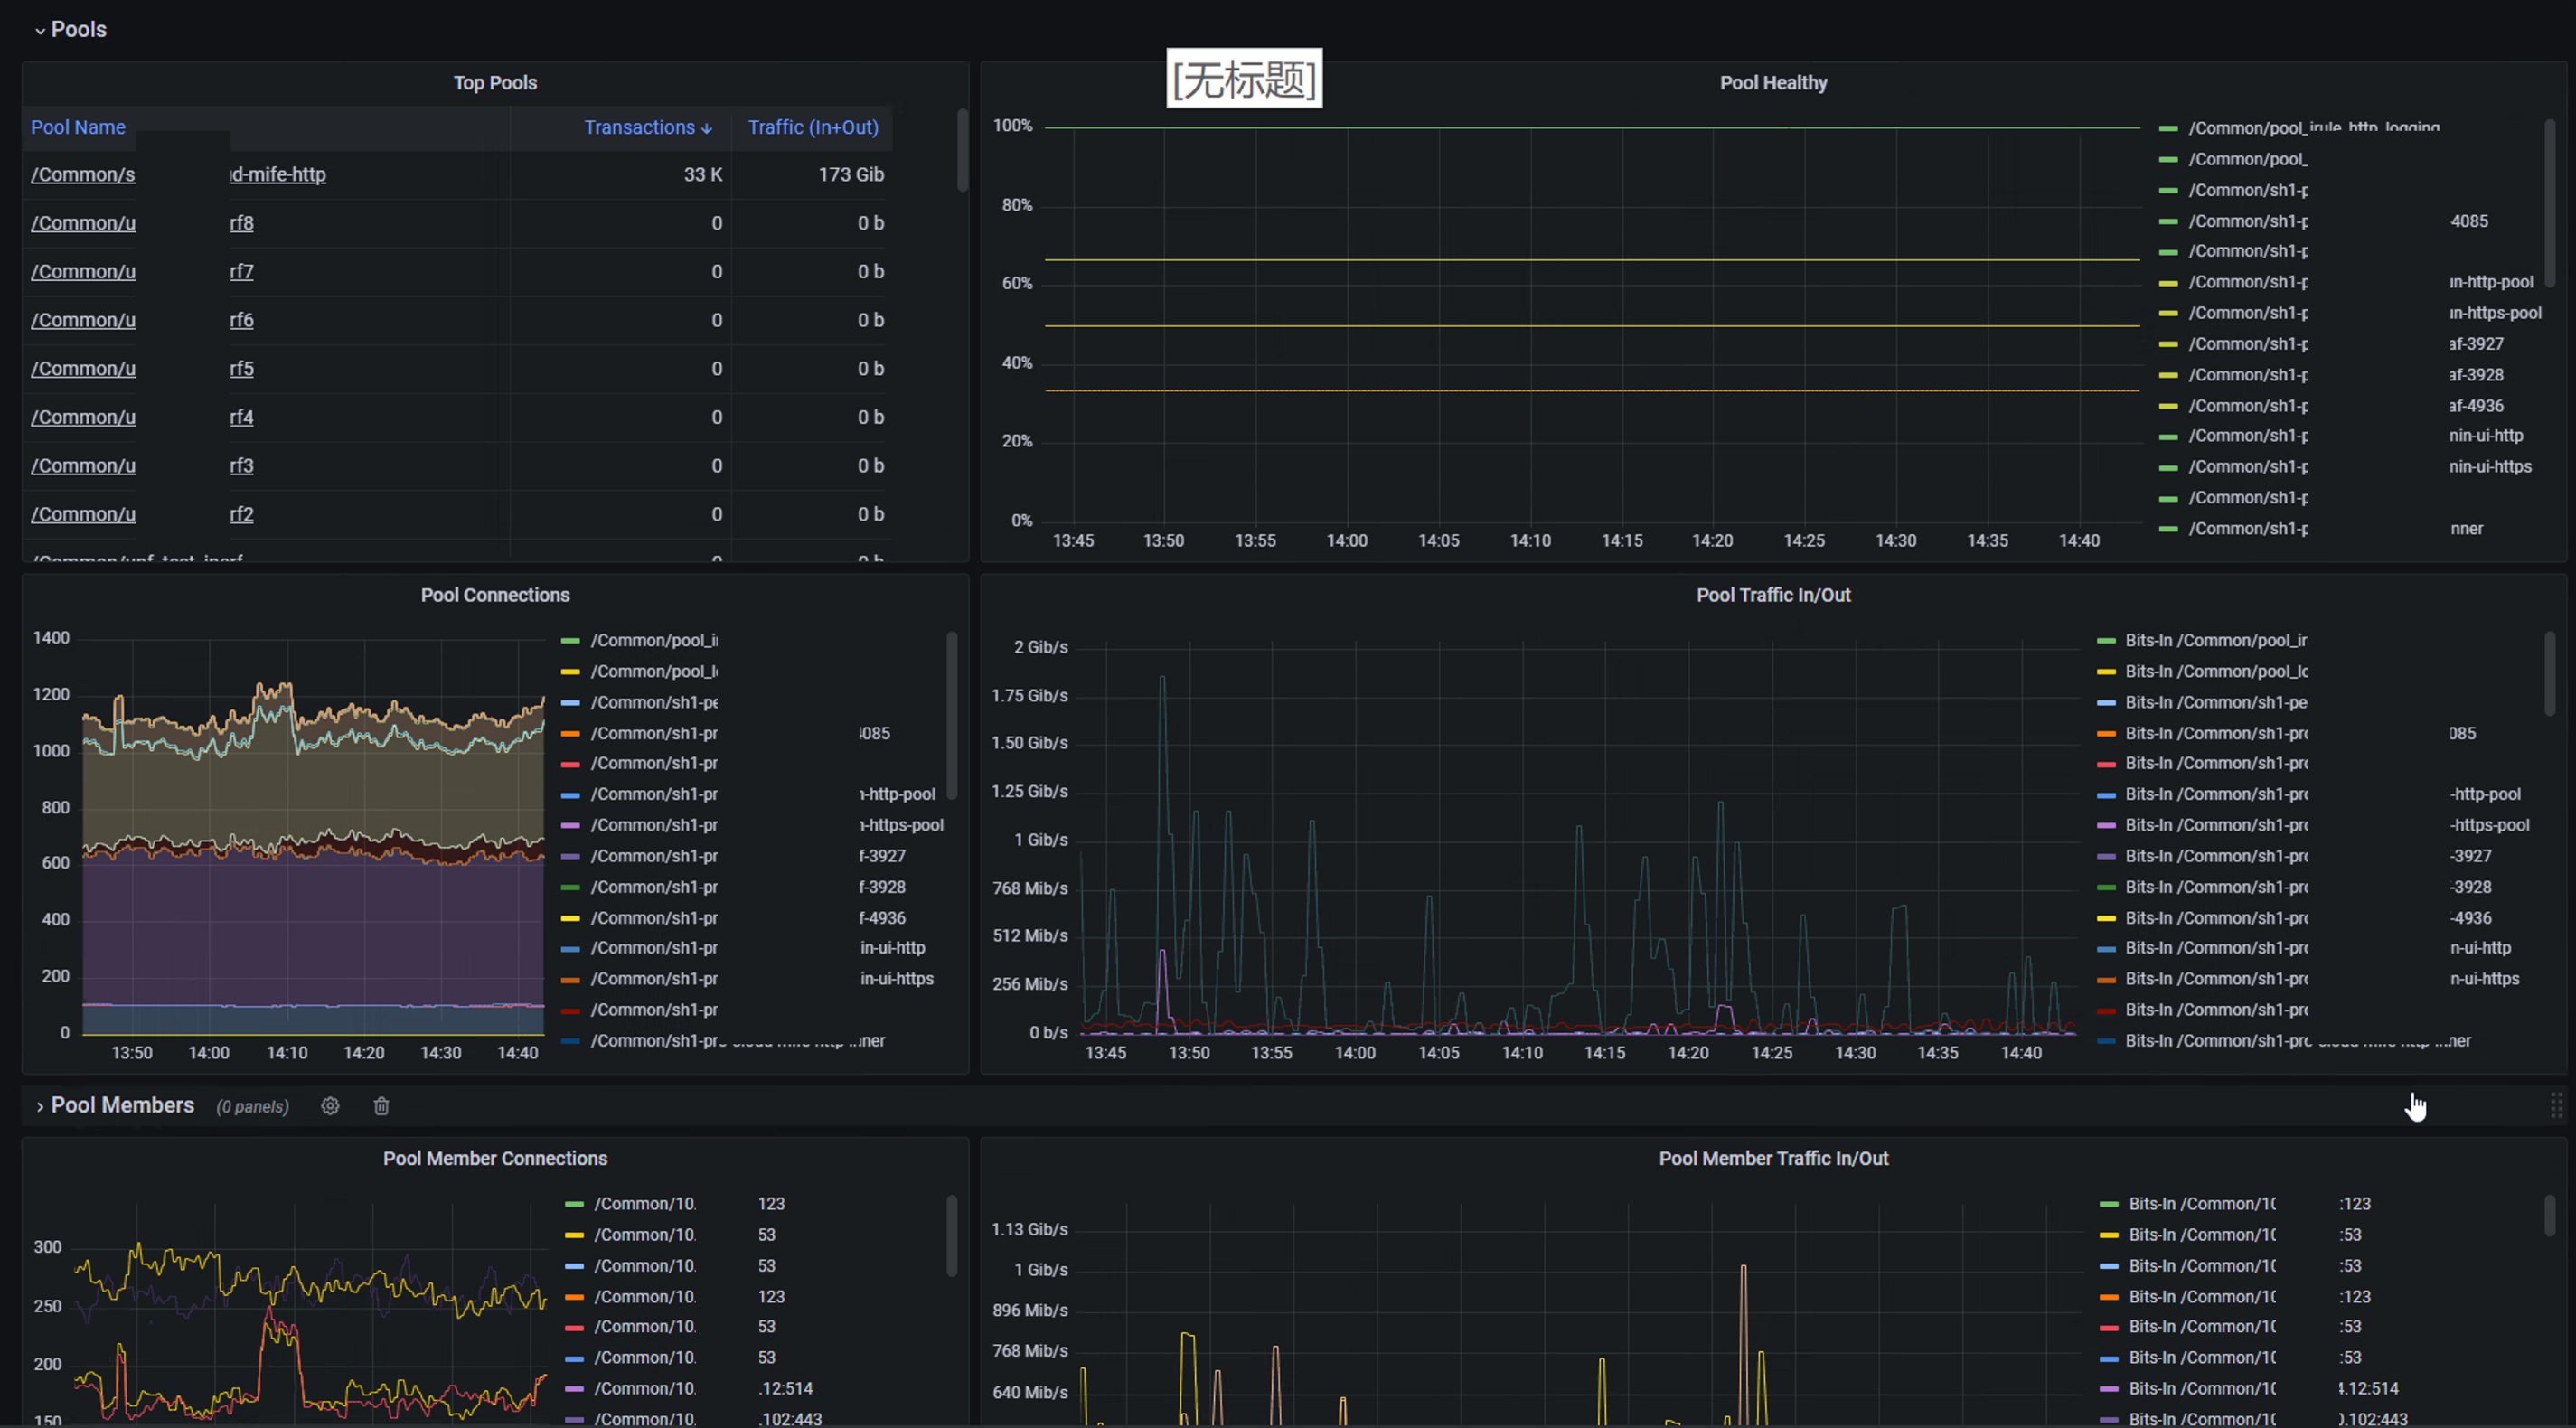
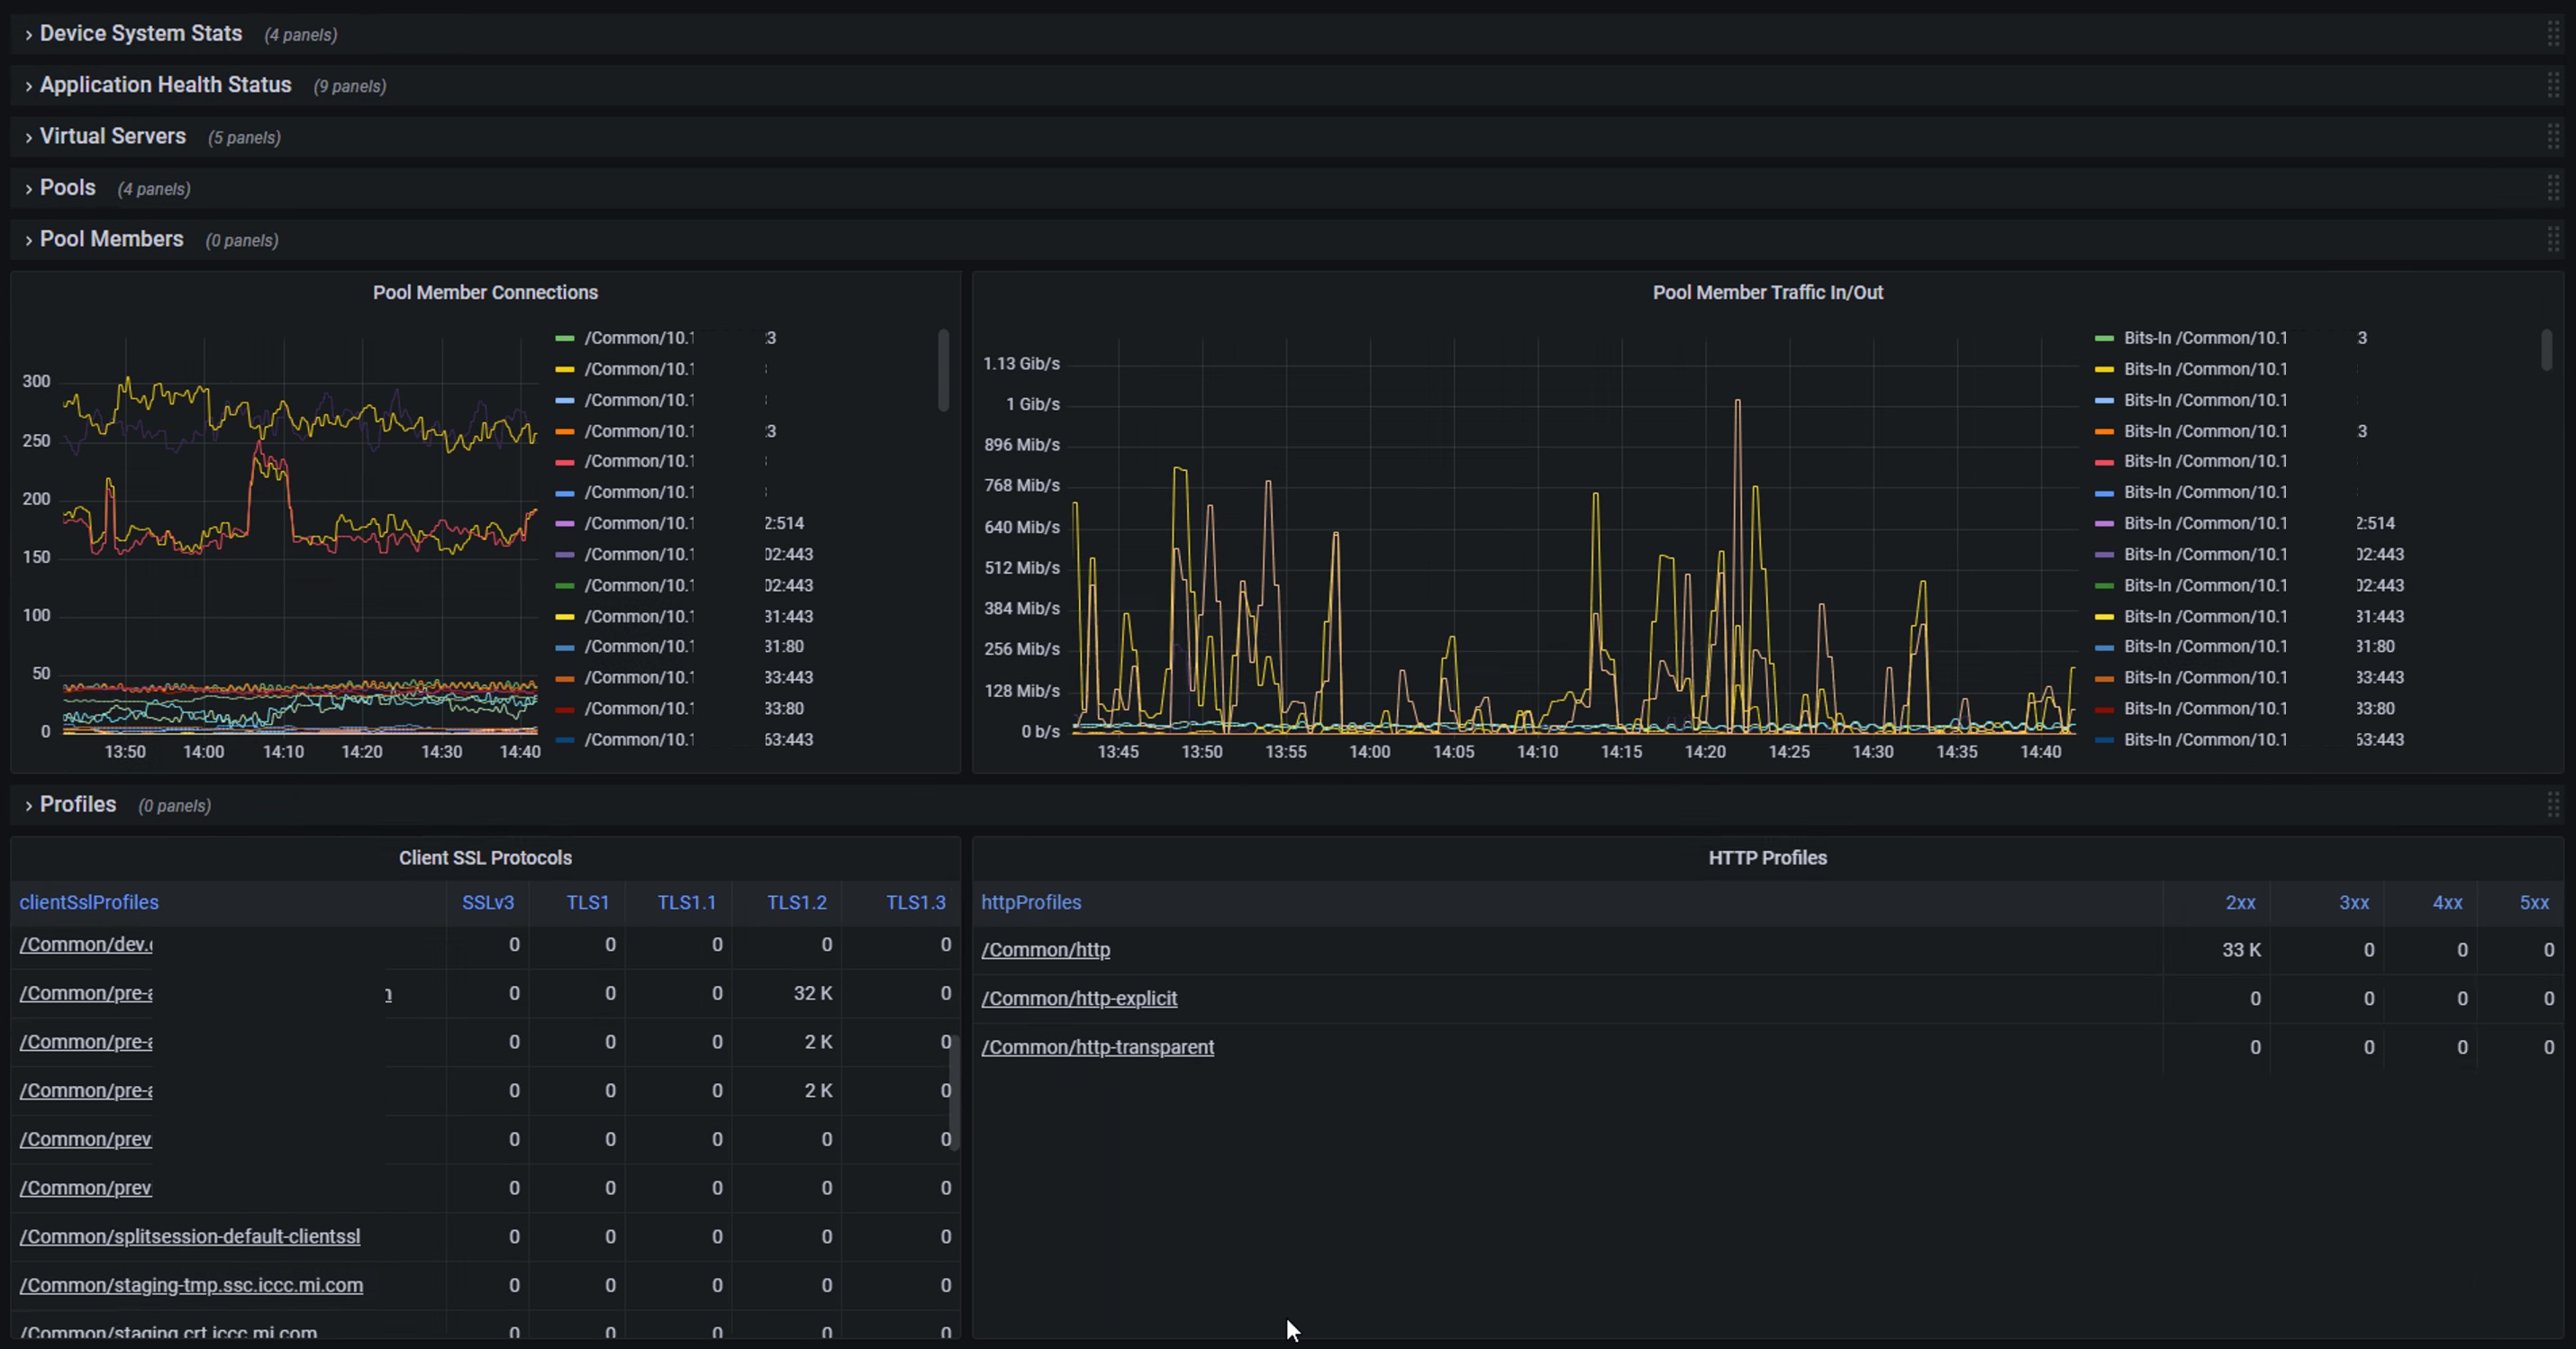
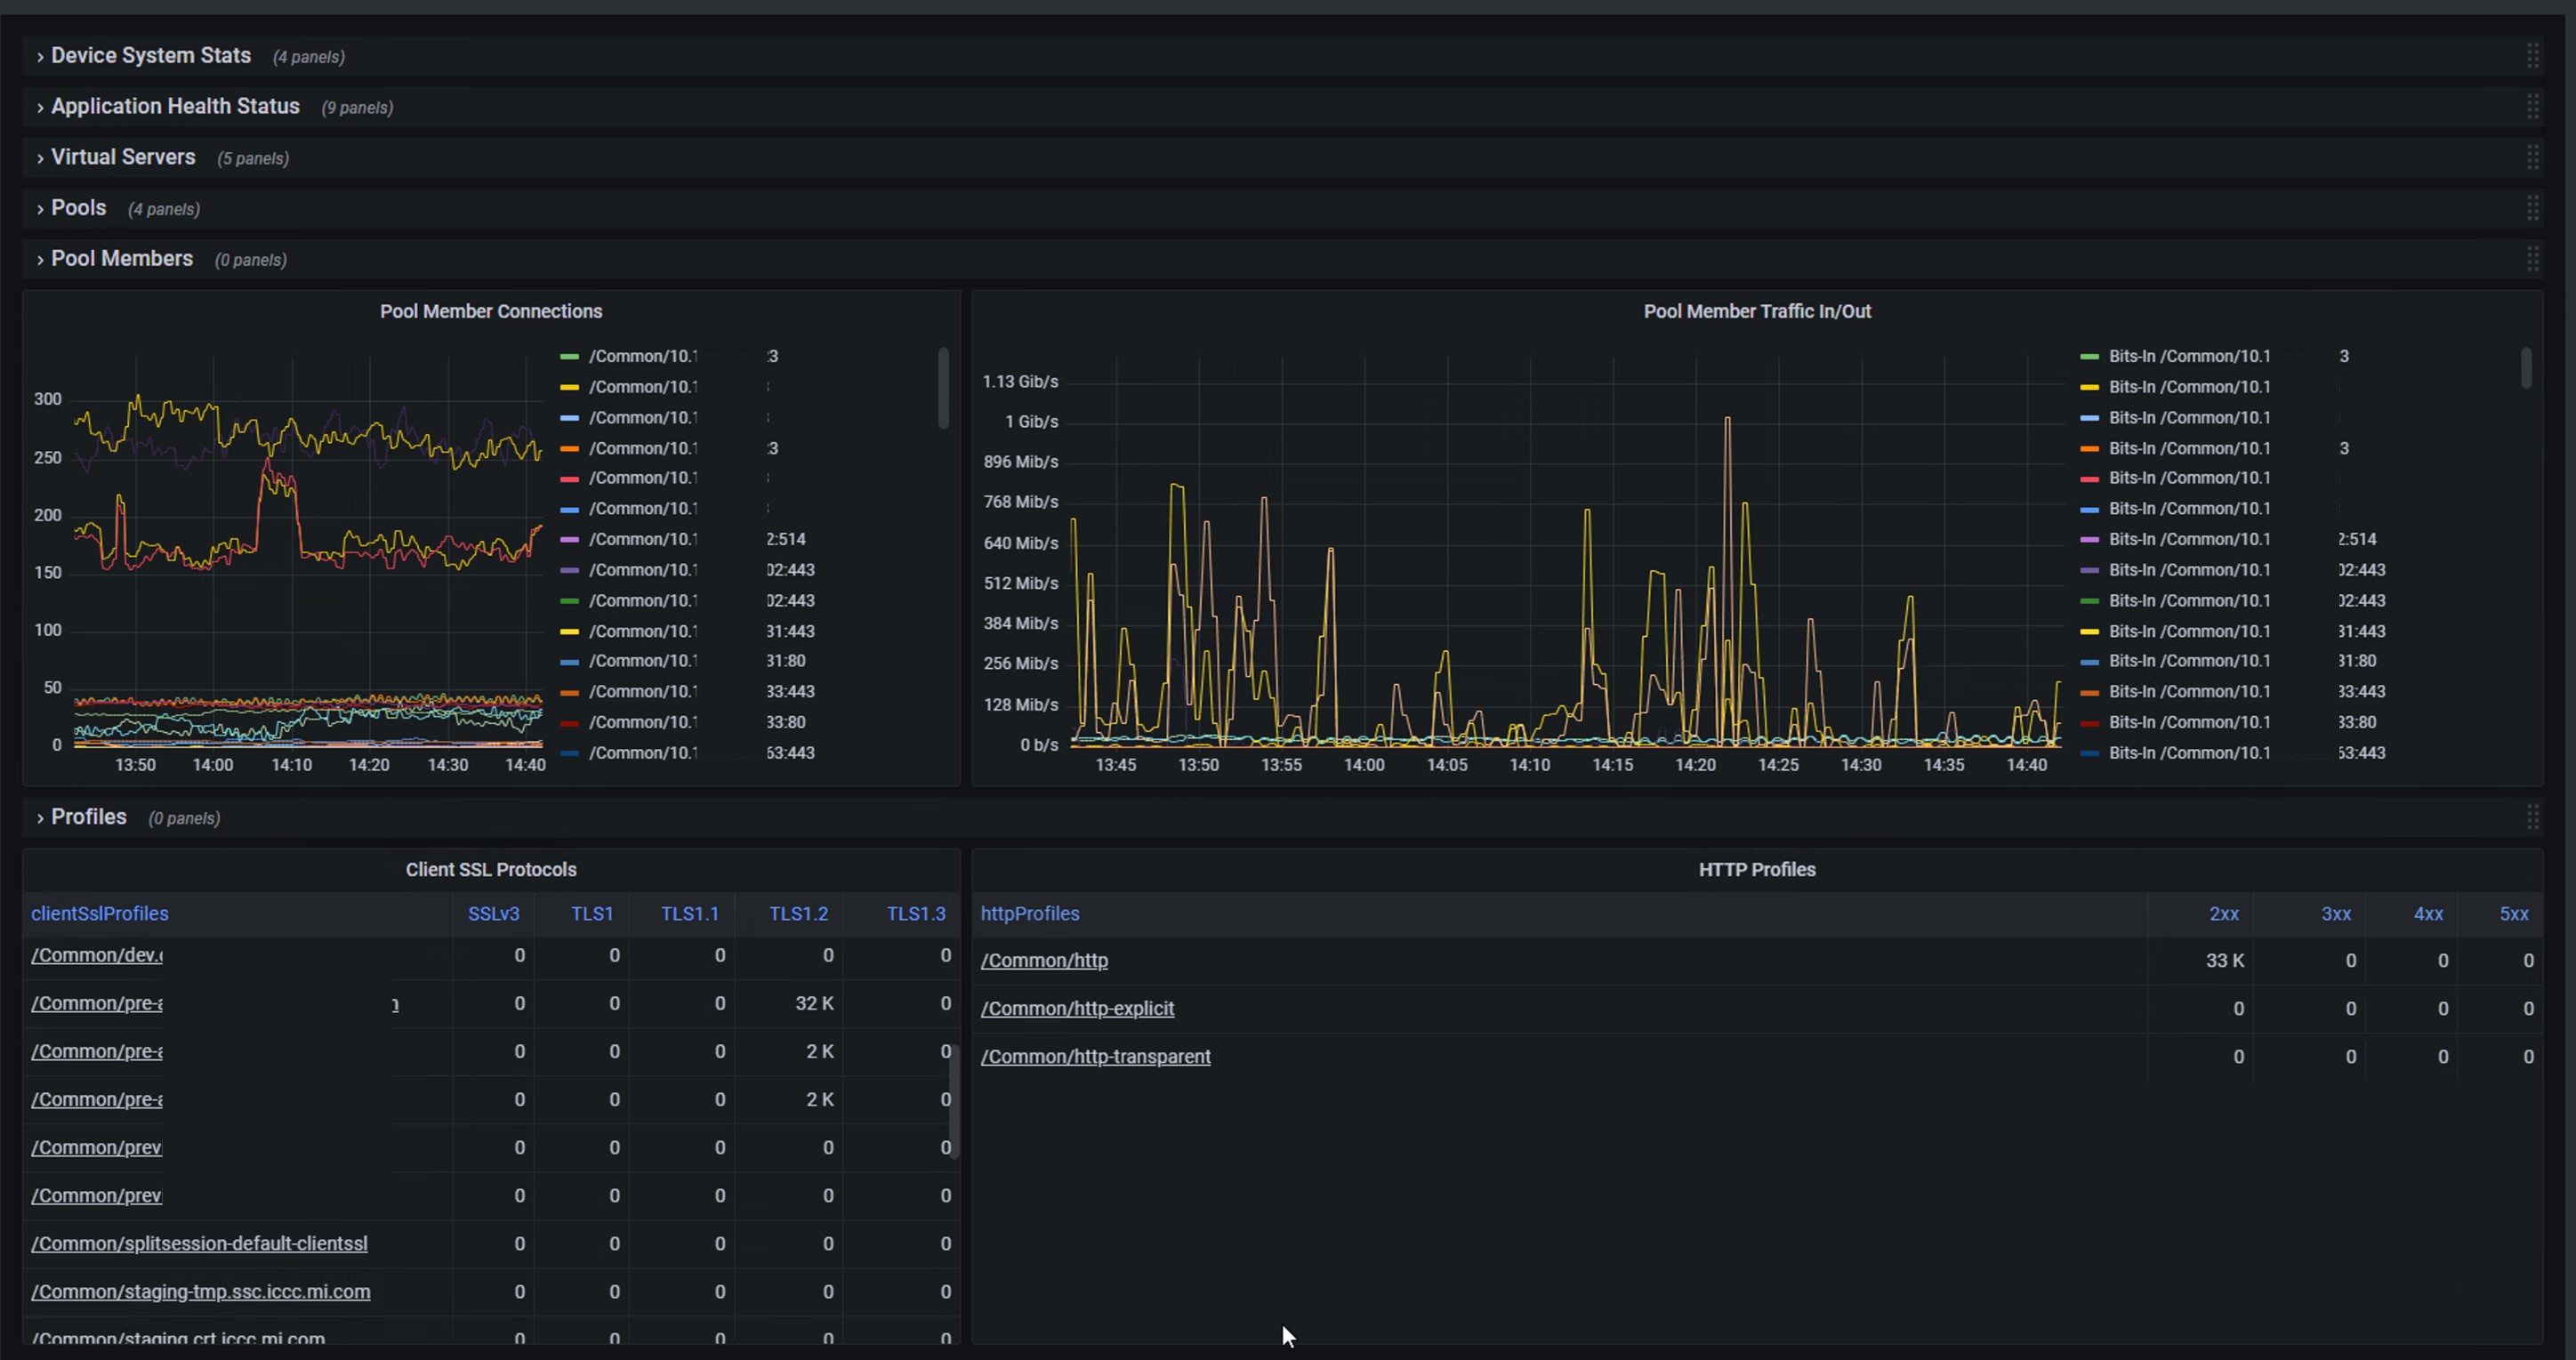
Main BIGIP Dashboard
Screenshots
Used Metrics 3636
f5_2xxResp
f5_3xxResp
f5_4xxResp
f5_5xxResp
f5_activeMemberCnt
f5_clientside_bitsIn
f5_clientside_bitsOut
f5_clientside_curConns
f5_clientside_totConns
f5_isAvailable
f5_isEnabled
f5_port
f5_protocolUses_sslv3
f5_protocolUses_tlsv1
f5_protocolUses_tlsv1_1
f5_protocolUses_tlsv1_2
f5_protocolUses_tlsv1_3
f5_serverside_bitsIn
f5_serverside_bitsOut
f5_serverside_curConns
f5_system_connectionsPerformance_activeSslClientConnections_average
f5_system_connectionsPerformance_clientConnections_average
f5_system_connectionsPerformance_client_average
f5_system_connectionsPerformance_httpRequests_average
f5_system_connectionsPerformance_newSslClientConnections_average
f5_system_connectionsPerformance_serverConnections_average
f5_system_connectionsPerformance_server_average
f5_system_cpu
f5_system_memory
f5_system_throughputPerformance_clientBitsIn_average
f5_system_throughputPerformance_clientBitsOut_average
f5_system_throughputPerformance_serverBitsIn_average
f5_system_throughputPerformance_serverBitsOut_average
f5_system_tmmCpu
f5_system_tmmMemory
f5_totRequests