External Secrets 3,738,1973,738,197
Description
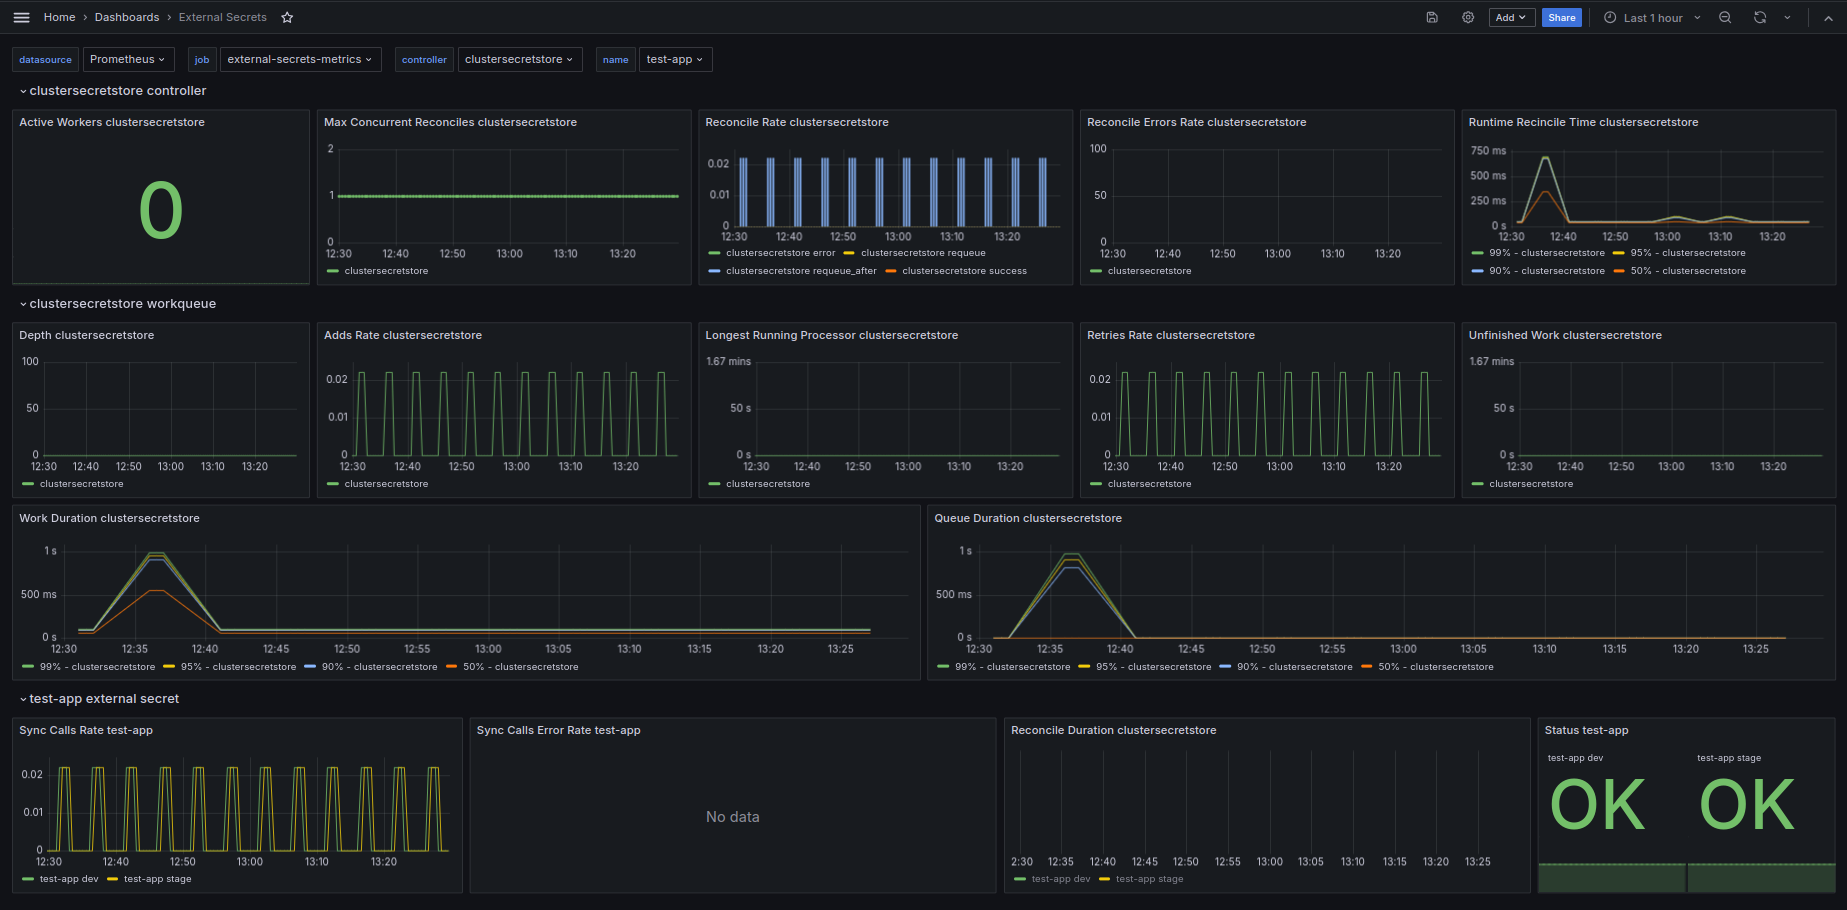
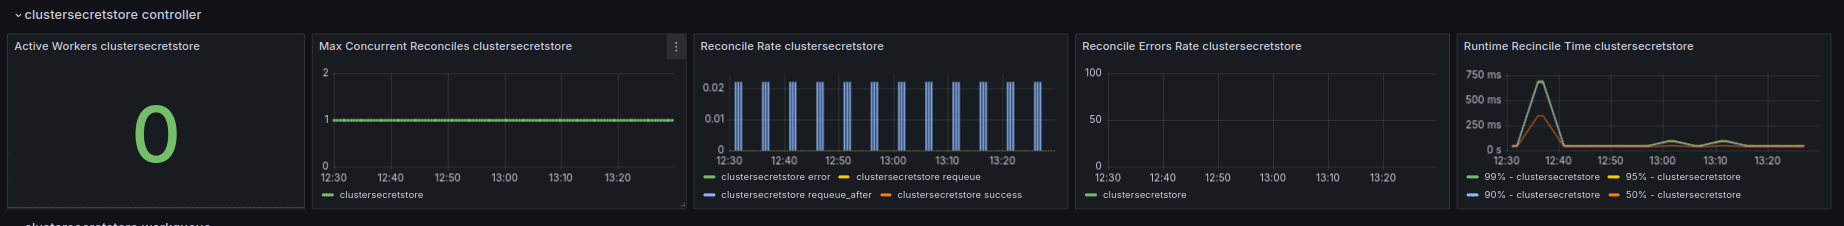
This dashboard monitors the health and performance of Kubernetes controllers by aggregating runtime, workqueue, and synchronization metrics. It highlights critical behavior such as controller_runtime_active_workers and controller_runtime_max_concurrent_reconciles for concurrency, controller_runtime_reconcile_time_seconds_bucket (latency distribution), and workqueue_adds_total and workqueue_unfinished_work_seconds to diagnose queuing delays and processing backlogs. Key features include per-controller and per-name breakdowns for reconciliation and sync calls and time-based streaks and rate calculations to quickly pinpoint bottlenecks and errors.
Screenshots
Used Metrics 1616
controller_runtime_active_workers
controller_runtime_max_concurrent_reconciles
controller_runtime_reconcile_errors_total
controller_runtime_reconcile_time_seconds_bucket
controller_runtime_reconcile_total
externalsecret_reconcile_duration
externalsecret_status_condition
externalsecret_sync_calls_error
externalsecret_sync_calls_total
workqueue_adds_total
workqueue_depth
workqueue_longest_running_processor_seconds
workqueue_queue_duration_seconds_bucket
workqueue_retries_total
workqueue_unfinished_work_seconds
workqueue_work_duration_seconds_bucket