External DNS 7,702,4577,702,457
Description
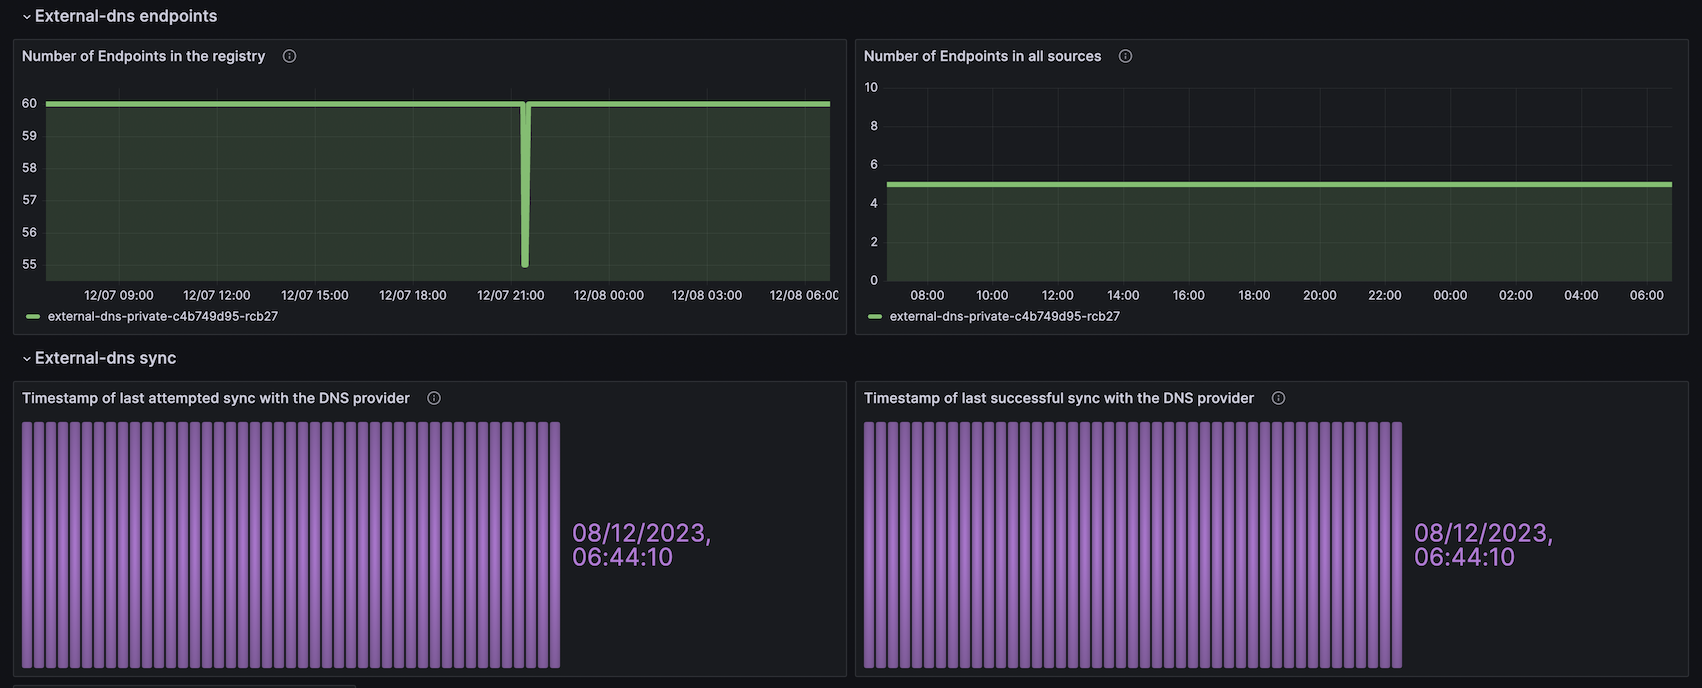
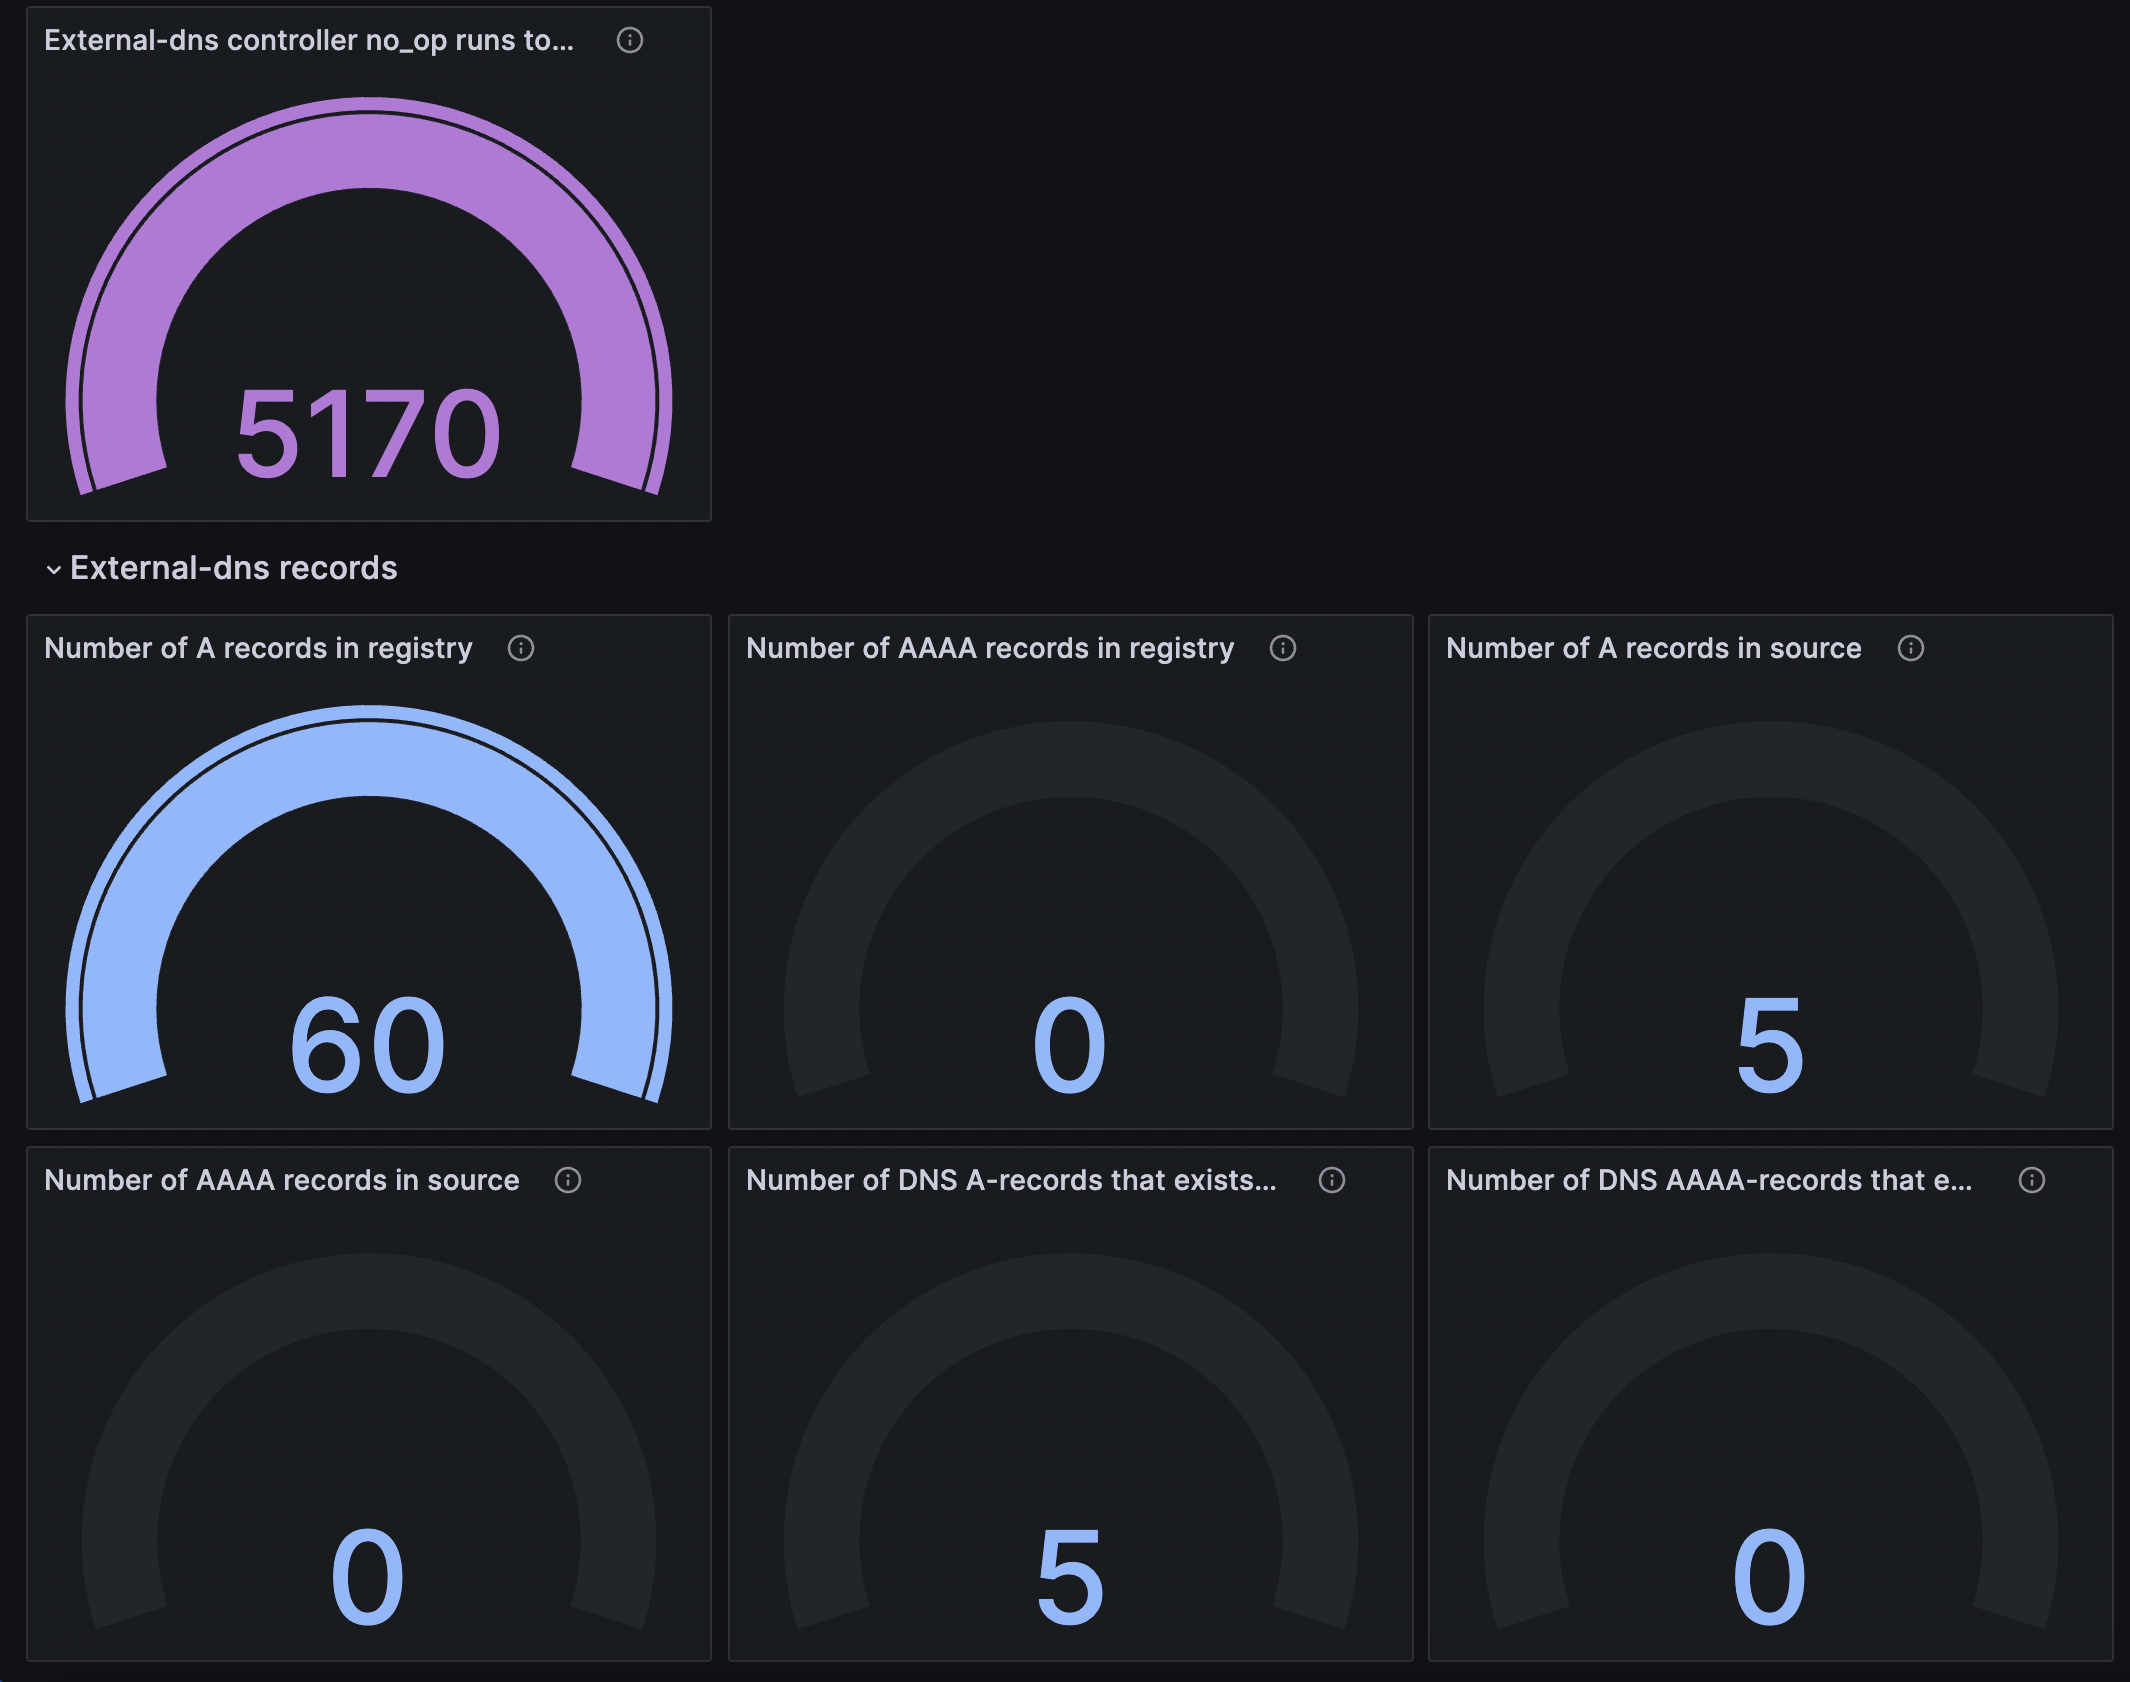
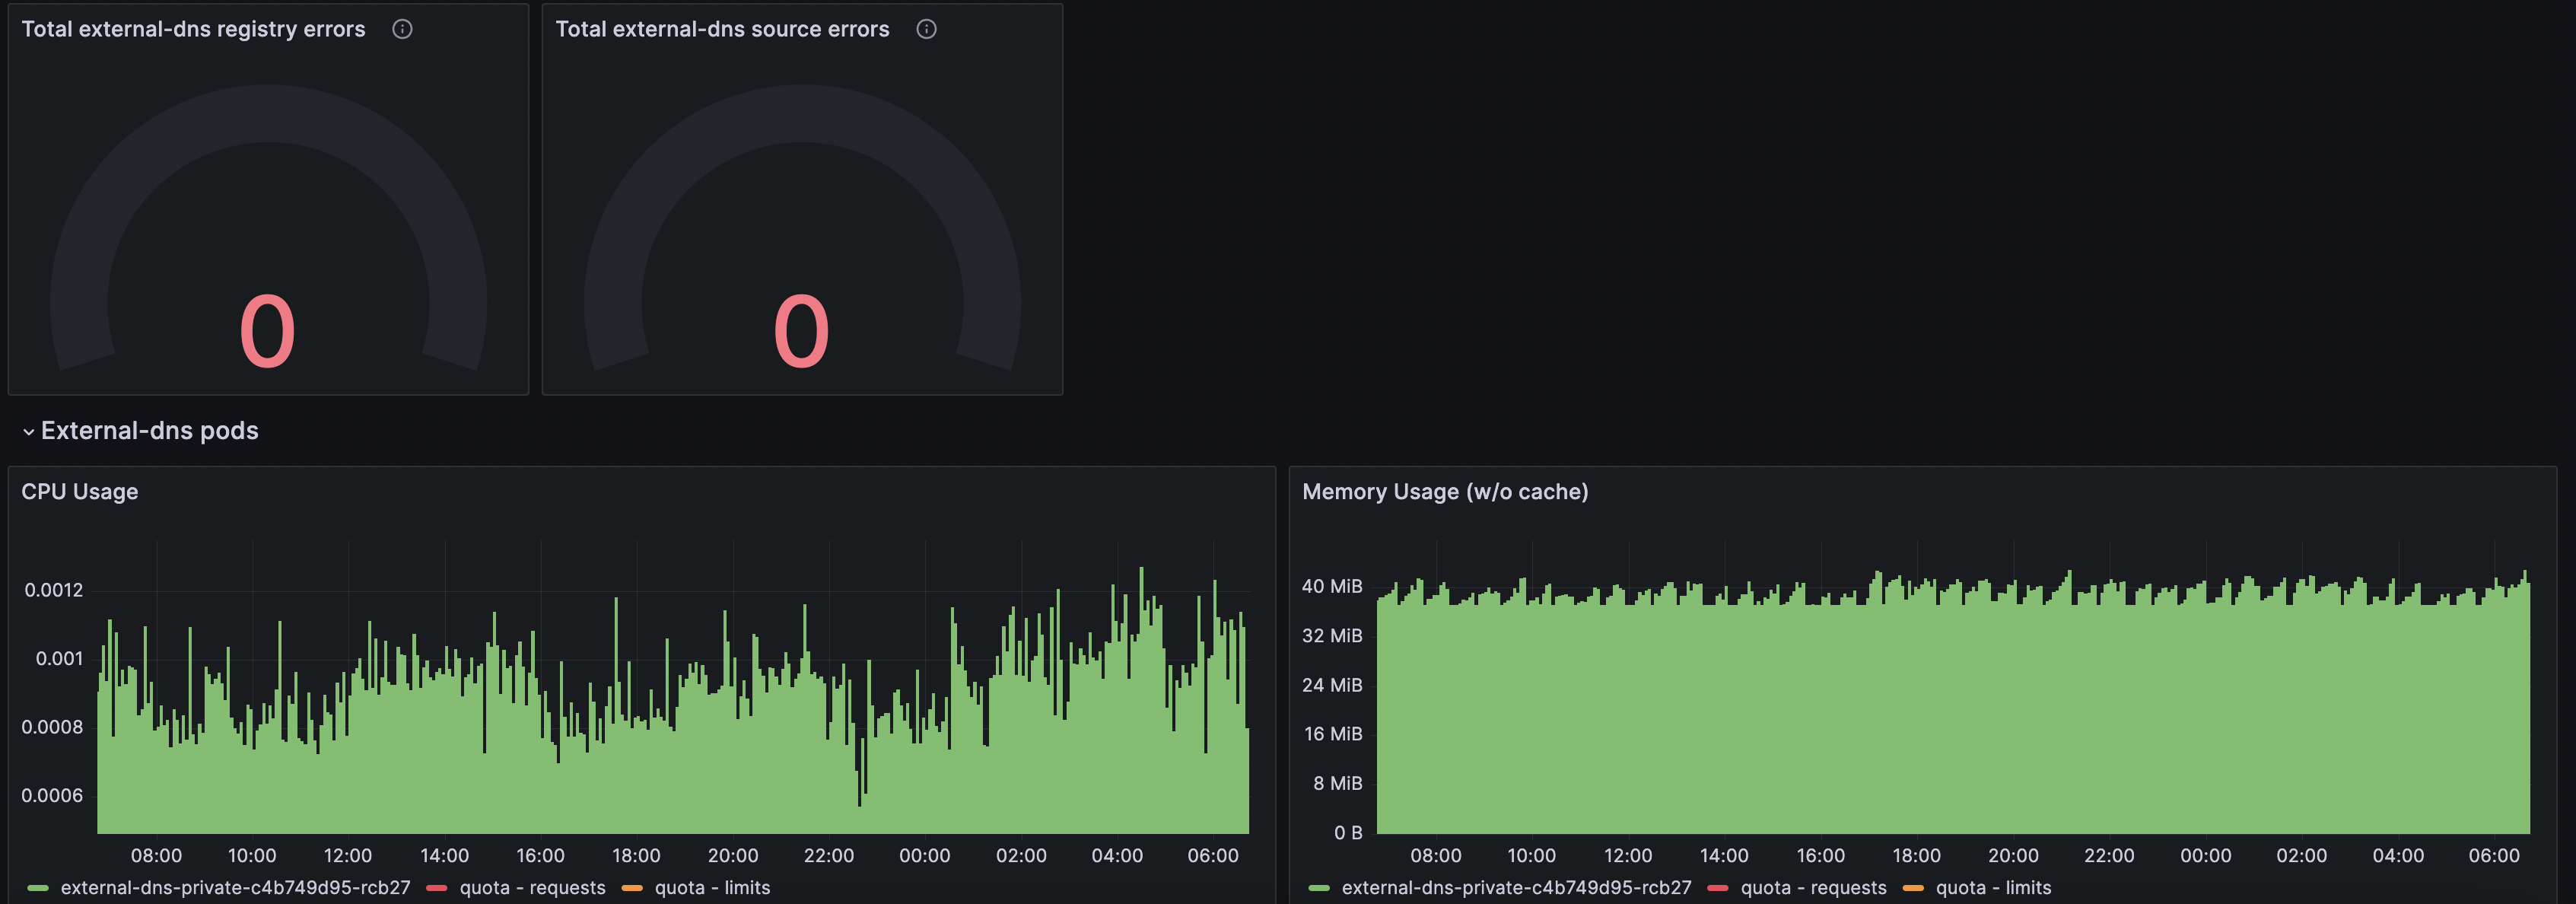
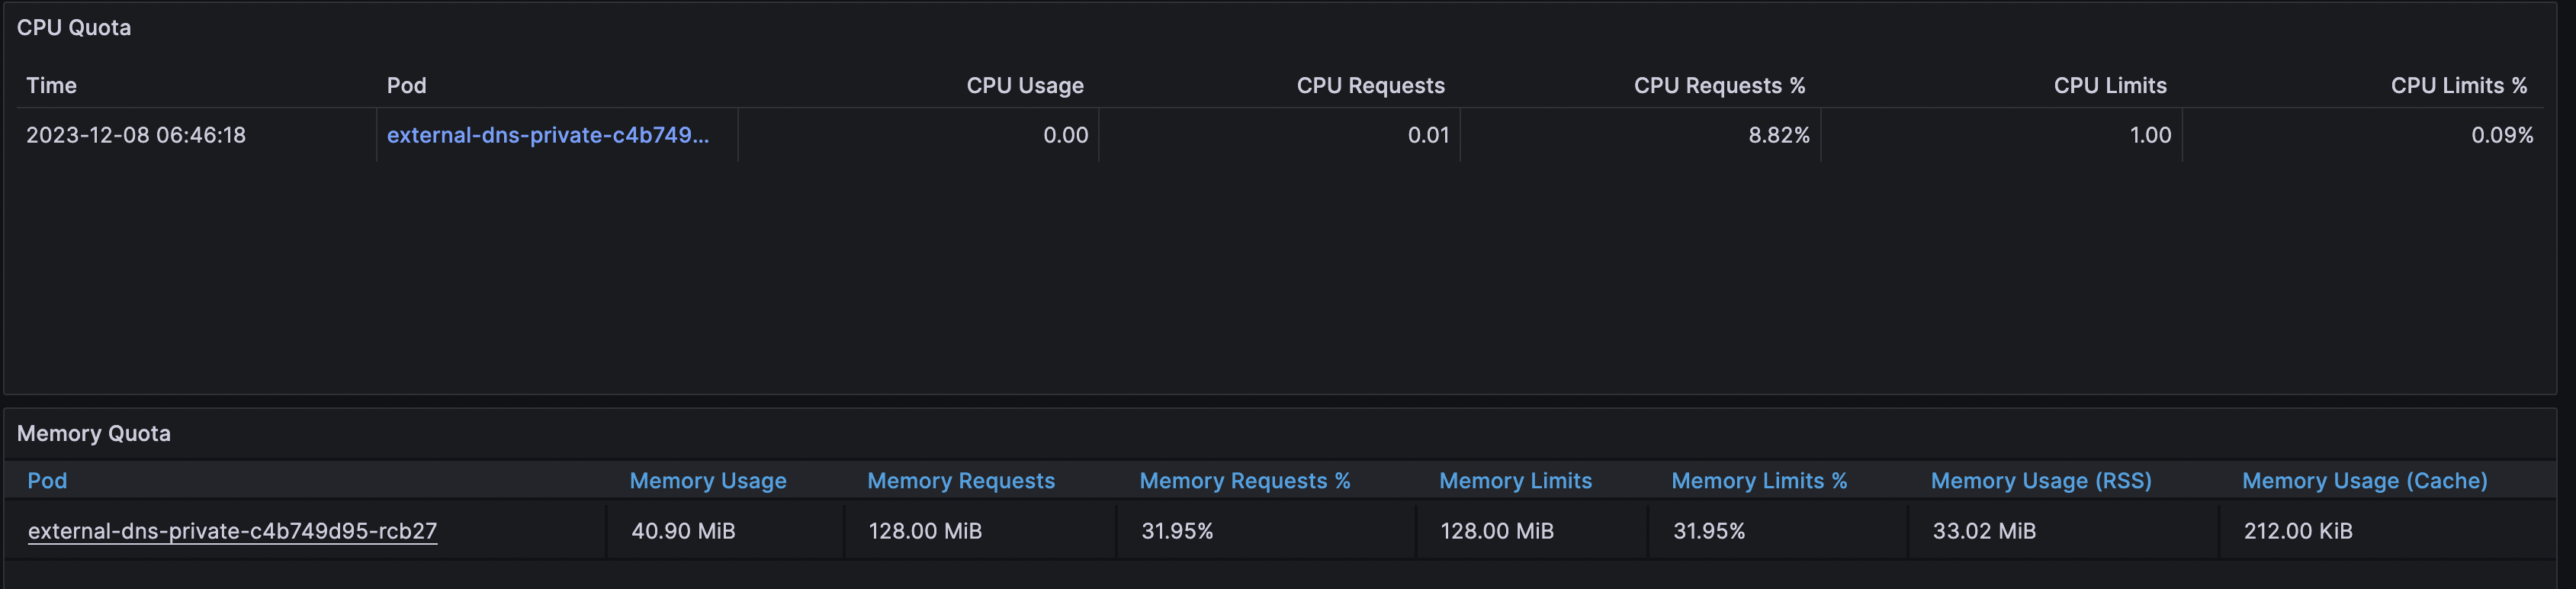
This dashboard monitors the health and synchronization state of an External DNS setup, correlating registry data with multiple sources and the controller’s activity. It highlights operational timing (reconcile and sync timestamps), registry vs source parity for A/AAAA records, and controller activity (no_op runs) alongside resource usage and error metrics. Key metrics include external_dns_controller_last_reconcile_timestamp_seconds, external_dns_registry_a_records vs external_dns_source_a_records, and external_dns_controller_no_op_runs_total to gauge both correctness and efficiency, complemented by resource usage indicators like CPU and memory metrics.
Screenshots
Used Metrics 2121
-
container_memory_cache
-
container_memory_rss
-
container_memory_swap
-
container_memory_working_set_bytes
external_dns_controller_last_reconcile_timestamp_seconds
external_dns_controller_last_sync_timestamp_seconds
external_dns_controller_no_op_runs_total
external_dns_controller_verified_a_records
external_dns_controller_verified_aaaa_records
external_dns_registry_a_records
external_dns_registry_aaaa_records
external_dns_registry_endpoints_total
external_dns_registry_errors_total
external_dns_source_a_records
external_dns_source_aaaa_records
external_dns_source_endpoints_total
external_dns_source_errors_total
kube_pod_container_resource_limits
kube_pod_container_resource_requests
kube_resourcequota
node_namespace_pod_container:container_cpu_usage_seconds_total:sum_irate