Etcd by Prometheus 395,808395,808 4.0 (2 reviews)
9/1/2017
9/6/2017
3
Databases
>=4.4.1
Prometheus
Description
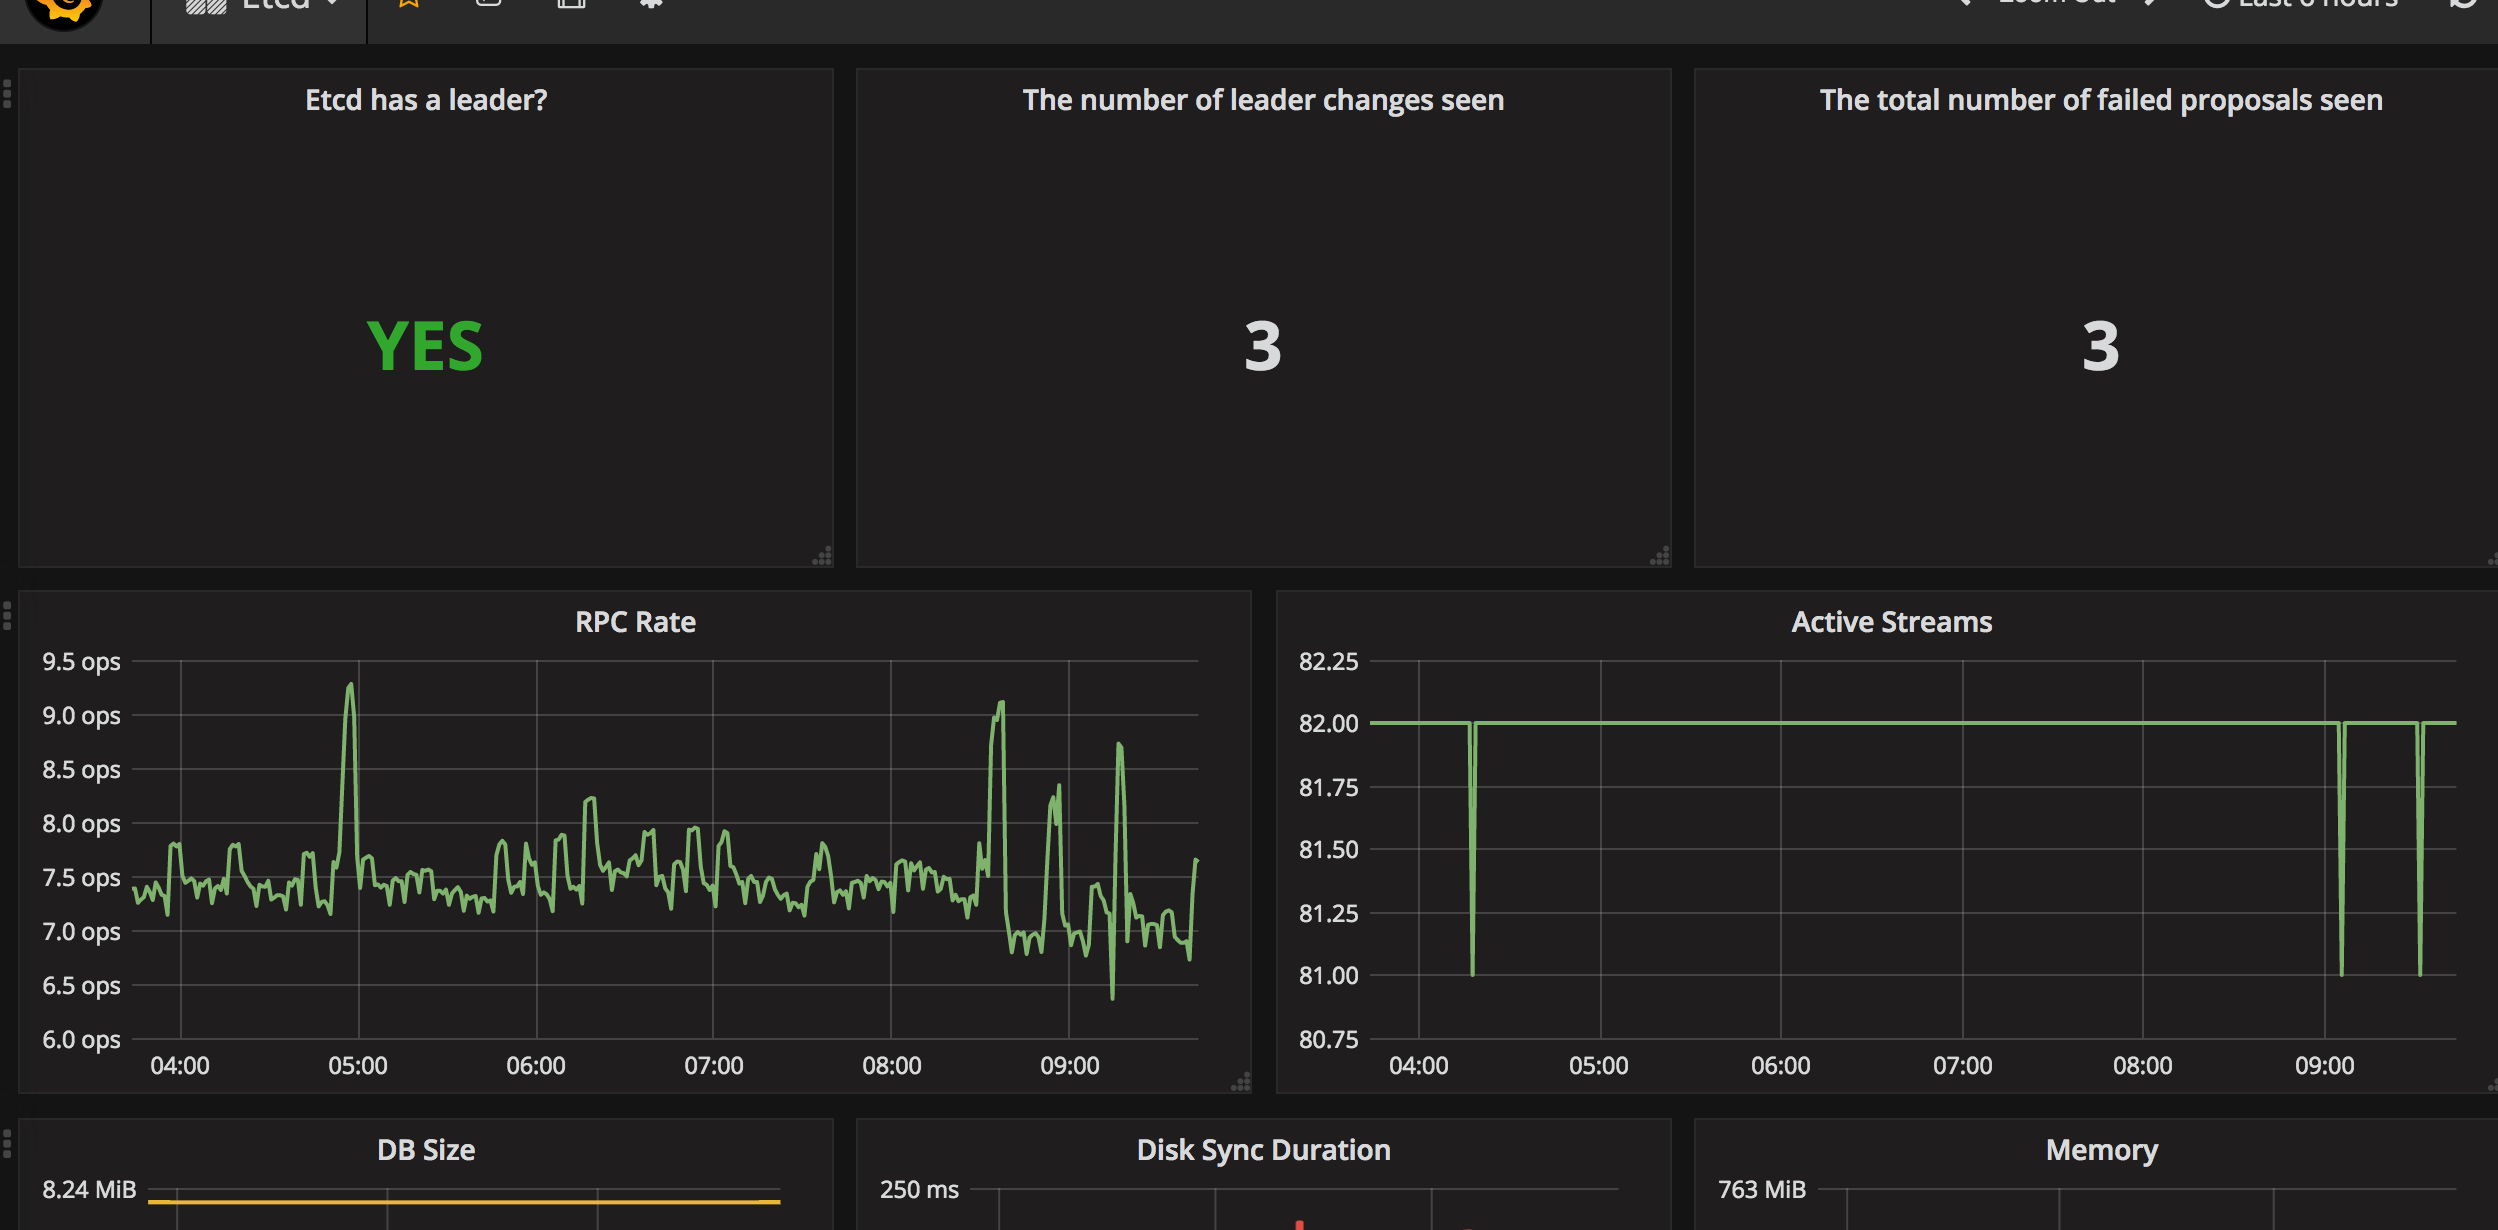
Monitors the health and performance of an etcd cluster using Prometheus metrics. It typically highlights key indicators such as etcd_server_alarm_count, etcd_disk_wal_fsync_duration_seconds, and etcd_mvcc_db_total_size_in_bytes to track availability, write latency, and storage growth. The dashboard features time-series panels for cluster-wide health, leader changes, and request latency, with alerting on critical thresholds and per-node breakdowns for quick troubleshooting.
Screenshots
Get Dashboard✕
Download
Copy to Clipboard