Envoy Proxy Monitoring gRPC 10,61010,610
Description
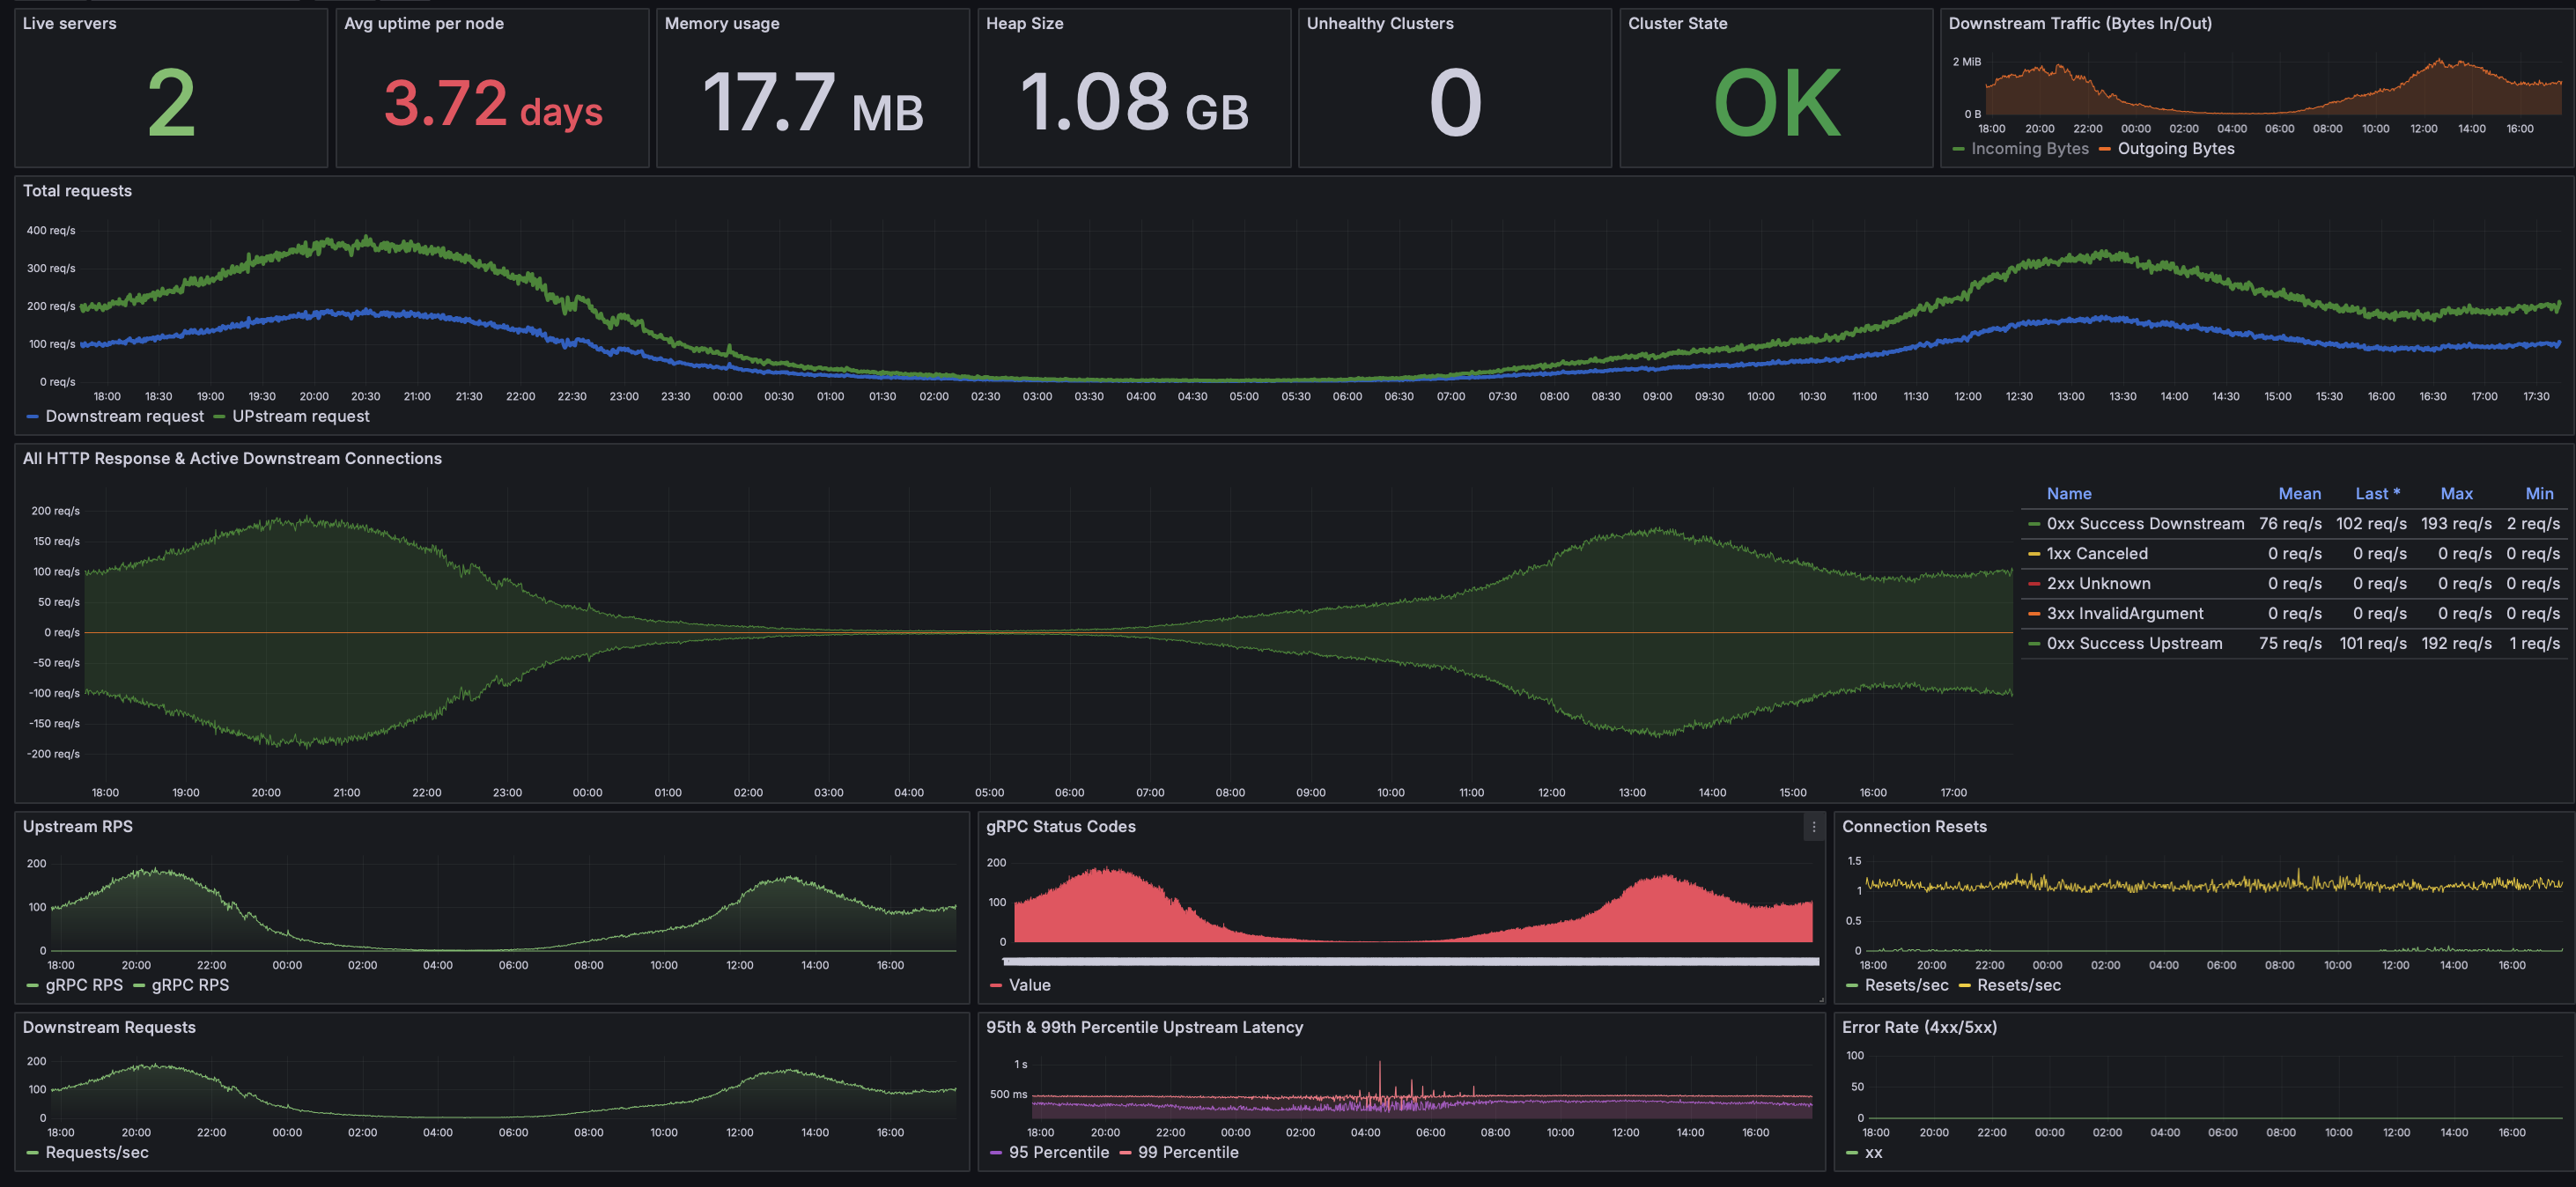
A comprehensive dashboard for real-time monitoring of Envoy Proxy metrics using Prometheus. Includes upstream/downstream request rates, memory usage, gRPC status codes, connection resets, latency percentiles (p95/p99), cluster health, and traffic in/out — with built-in IP/cluster filtering and clear color-coded visualization. Perfect for high-performance gRPC, HTTP/1/2/3, and service mesh environments.
Screenshots
Used Metrics 2020
envoy_cluster_external_upstream_rq_xx
envoy_cluster_membership_healthy
envoy_cluster_membership_total
envoy_cluster_upstream_cx_http1_total
envoy_cluster_upstream_cx_http2_total
envoy_cluster_upstream_cx_http3_total
envoy_cluster_upstream_rq_time_bucket
envoy_cluster_upstream_rq_total
envoy_cluster_upstream_rq_xx
envoy_http_downstream_cx_active
envoy_http_downstream_cx_destroy
envoy_http_downstream_cx_destroy_local_active_rq
envoy_http_downstream_cx_rx_bytes_total
envoy_http_downstream_cx_tx_bytes_total
envoy_http_downstream_rq_total
envoy_http_downstream_rq_xx
envoy_server_live
envoy_server_memory_allocated
envoy_server_memory_heap_size
envoy_server_uptime