Endlessh 1,4501,450 3.0 (1 reviews)
10/27/2021
11/7/2025
14
Host Metrics
>=12.3.0-18356121373.patch9
Prometheus
Description
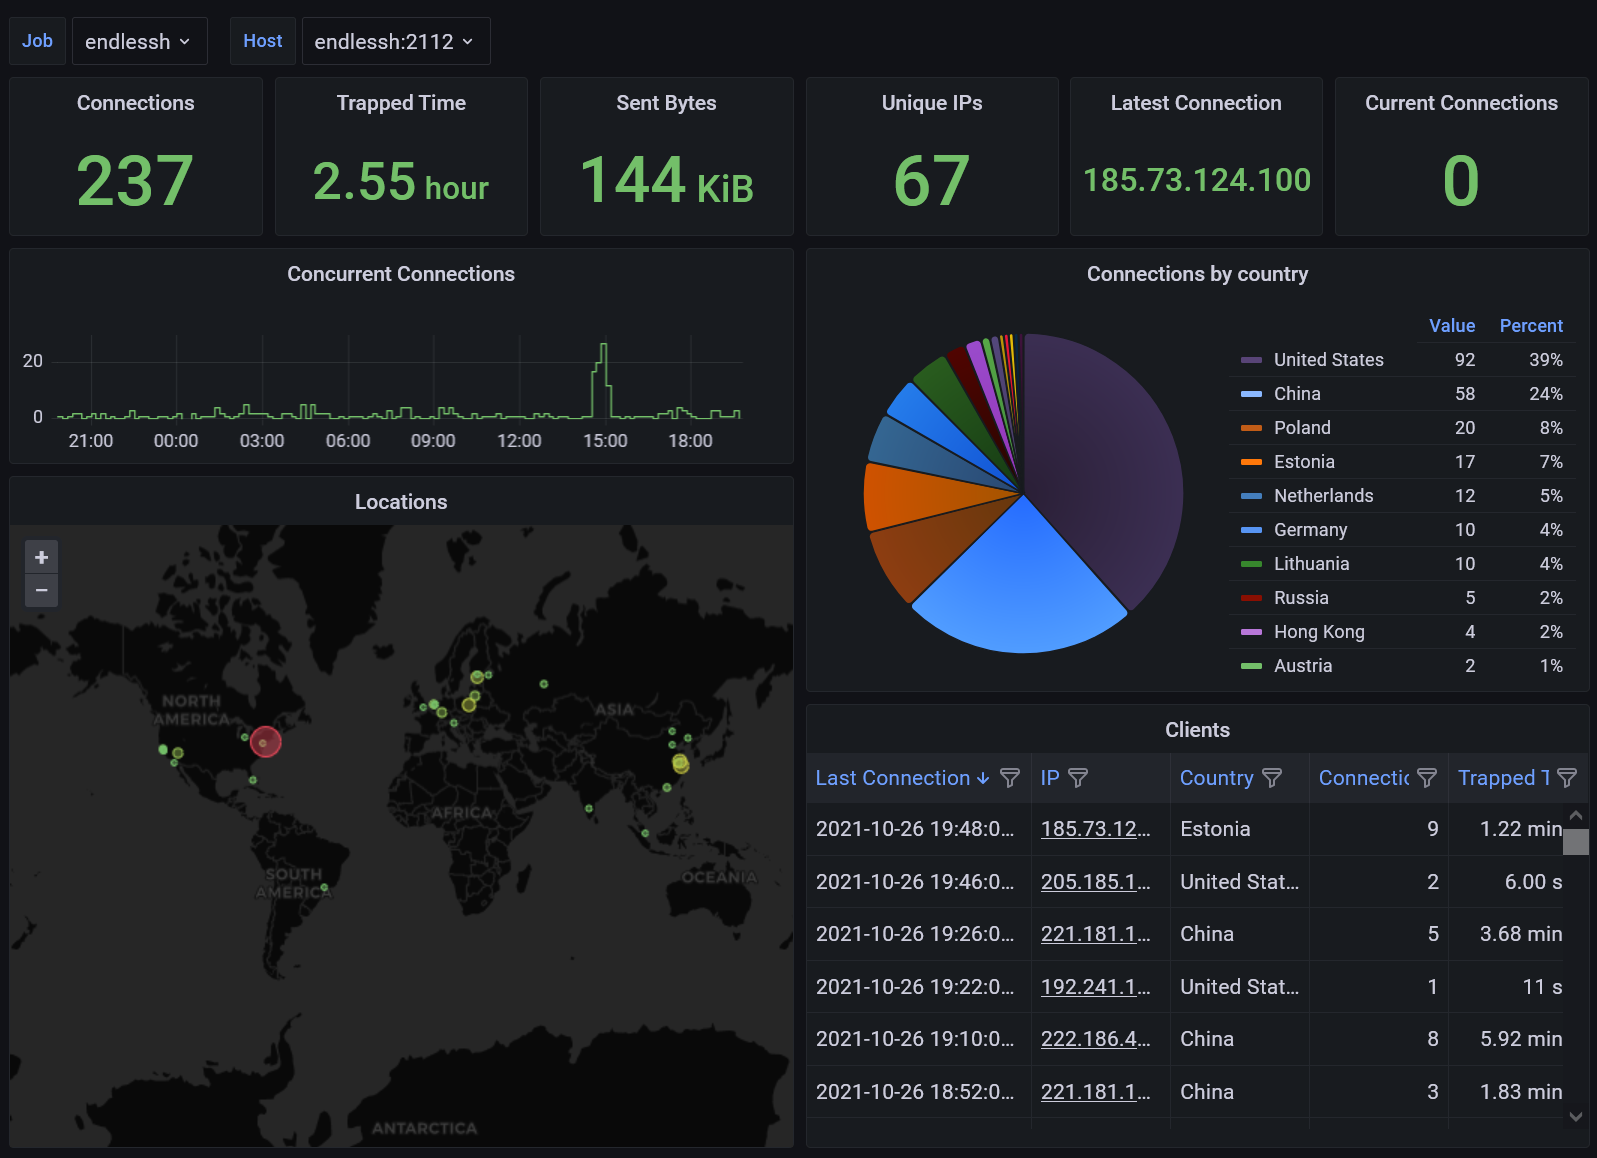
Dashboard for endlessh (Add ports selection)
Screenshots
Used Metrics 55
endlessh_client_closed_count_total
endlessh_client_open_count
endlessh_client_open_count_total
endlessh_client_trapped_time_seconds
endlessh_sent_bytes_total
Get Dashboard✕
Download
Copy to Clipboard