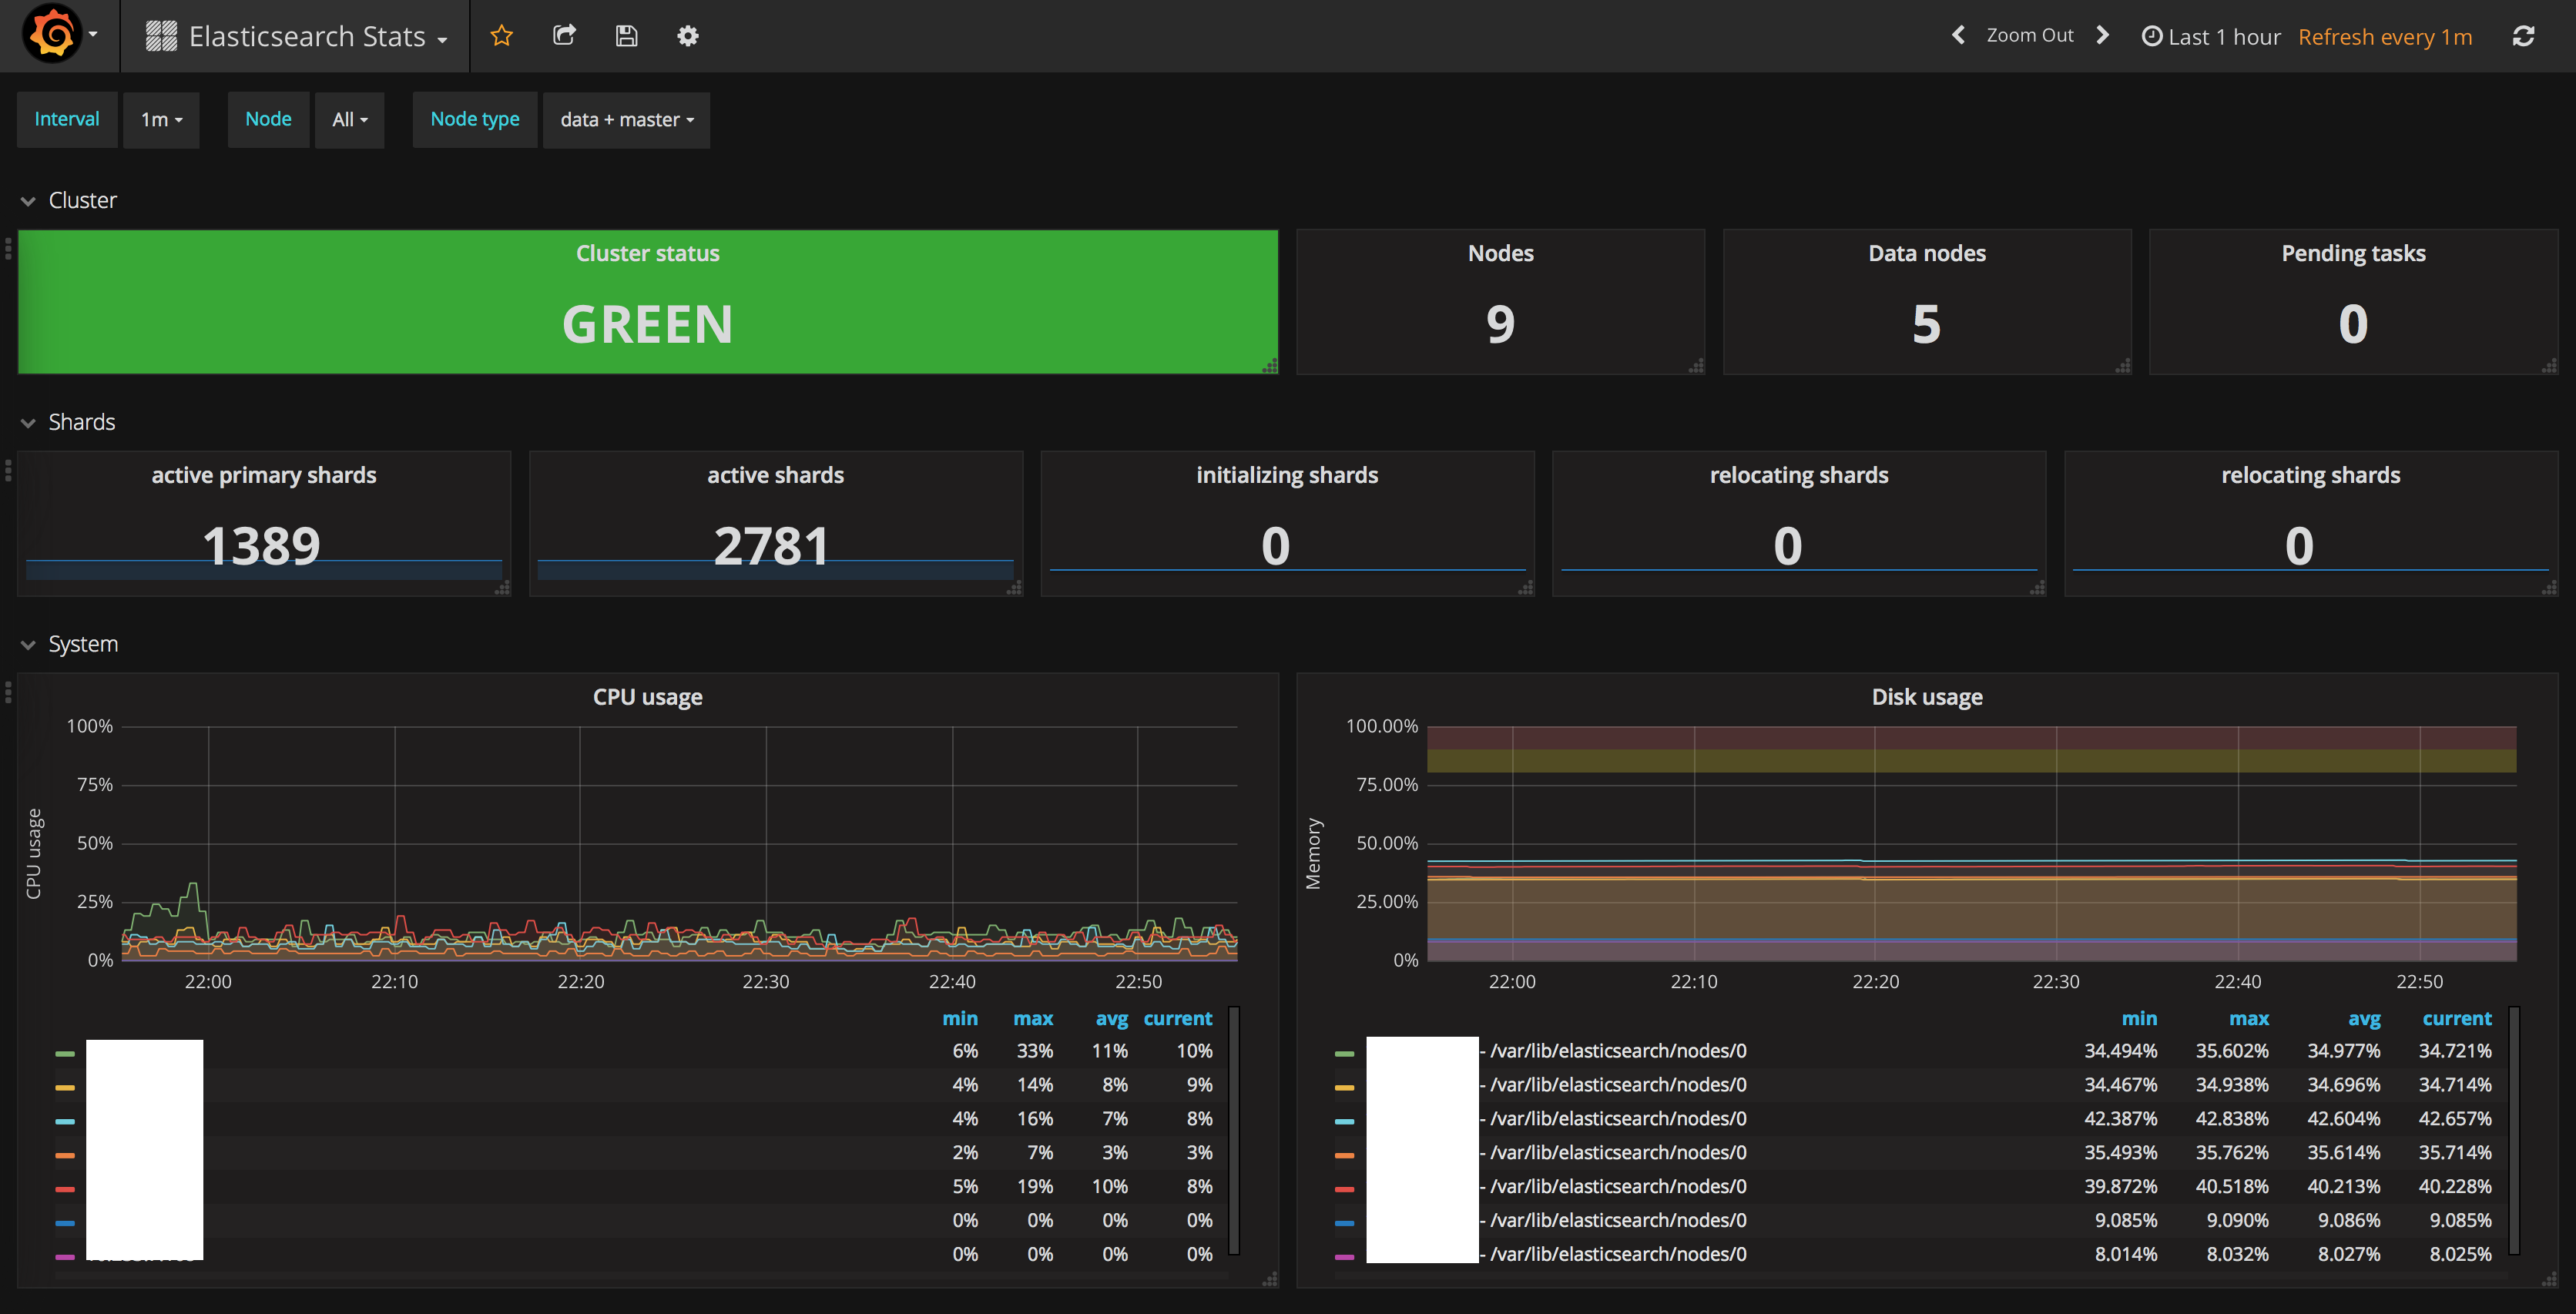
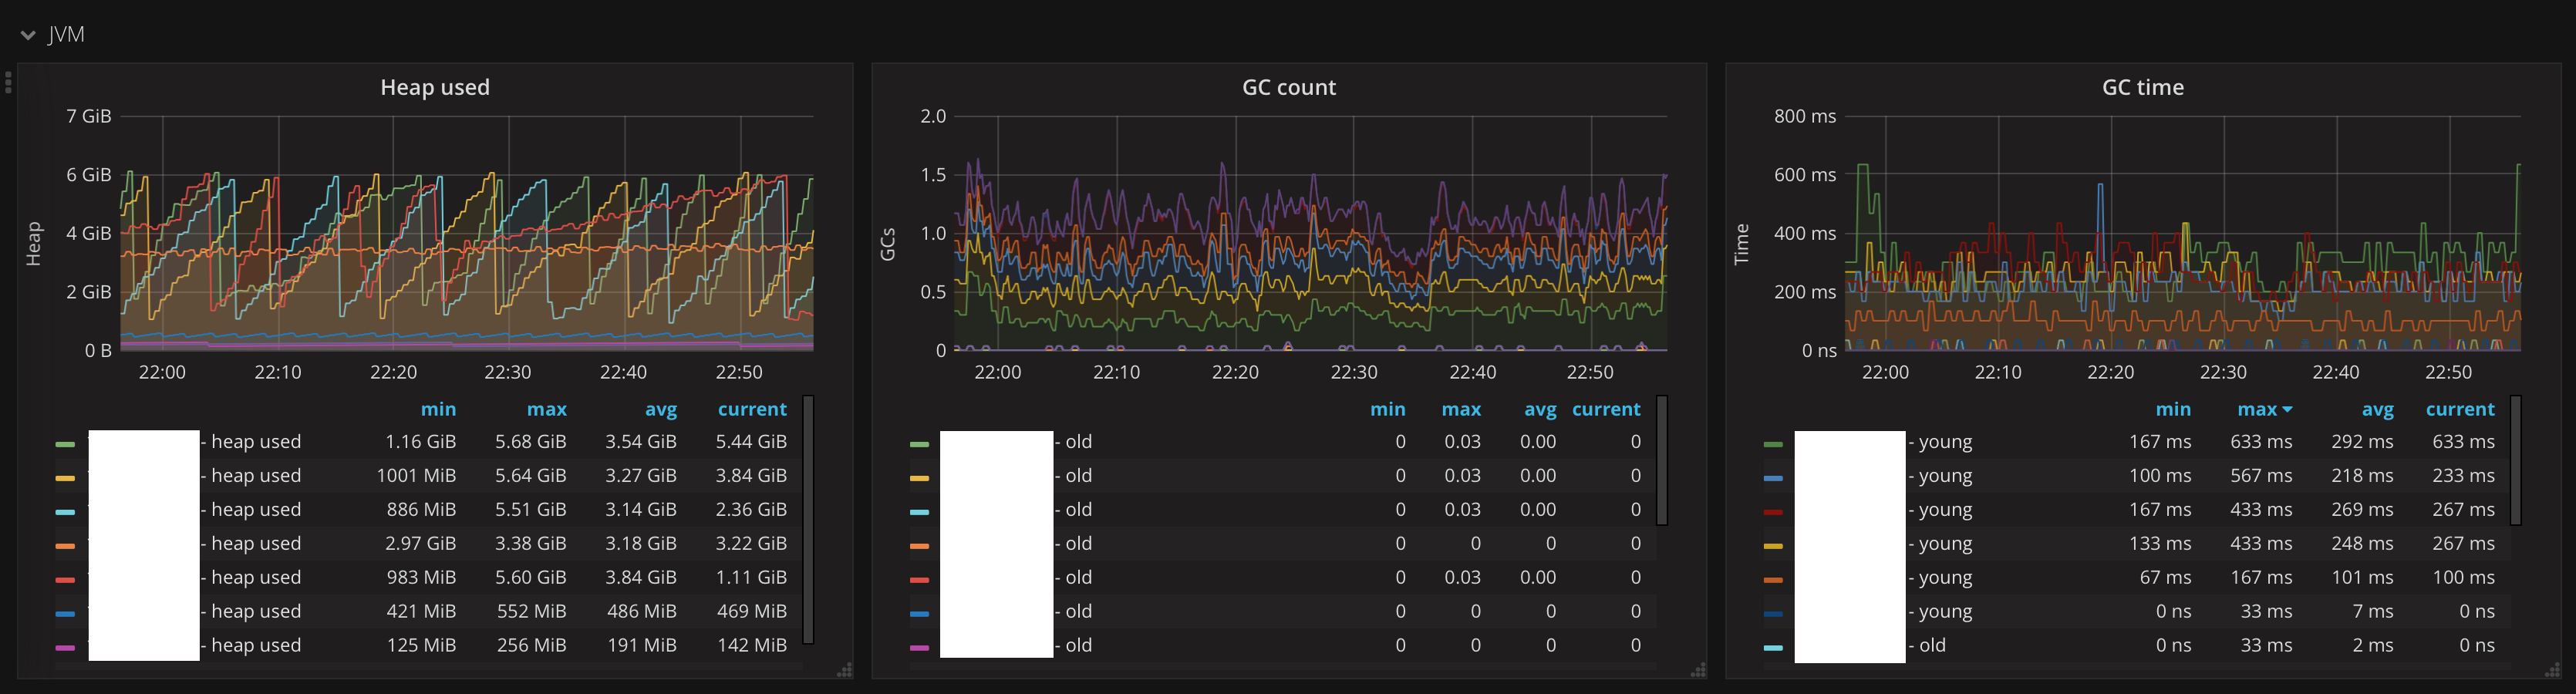
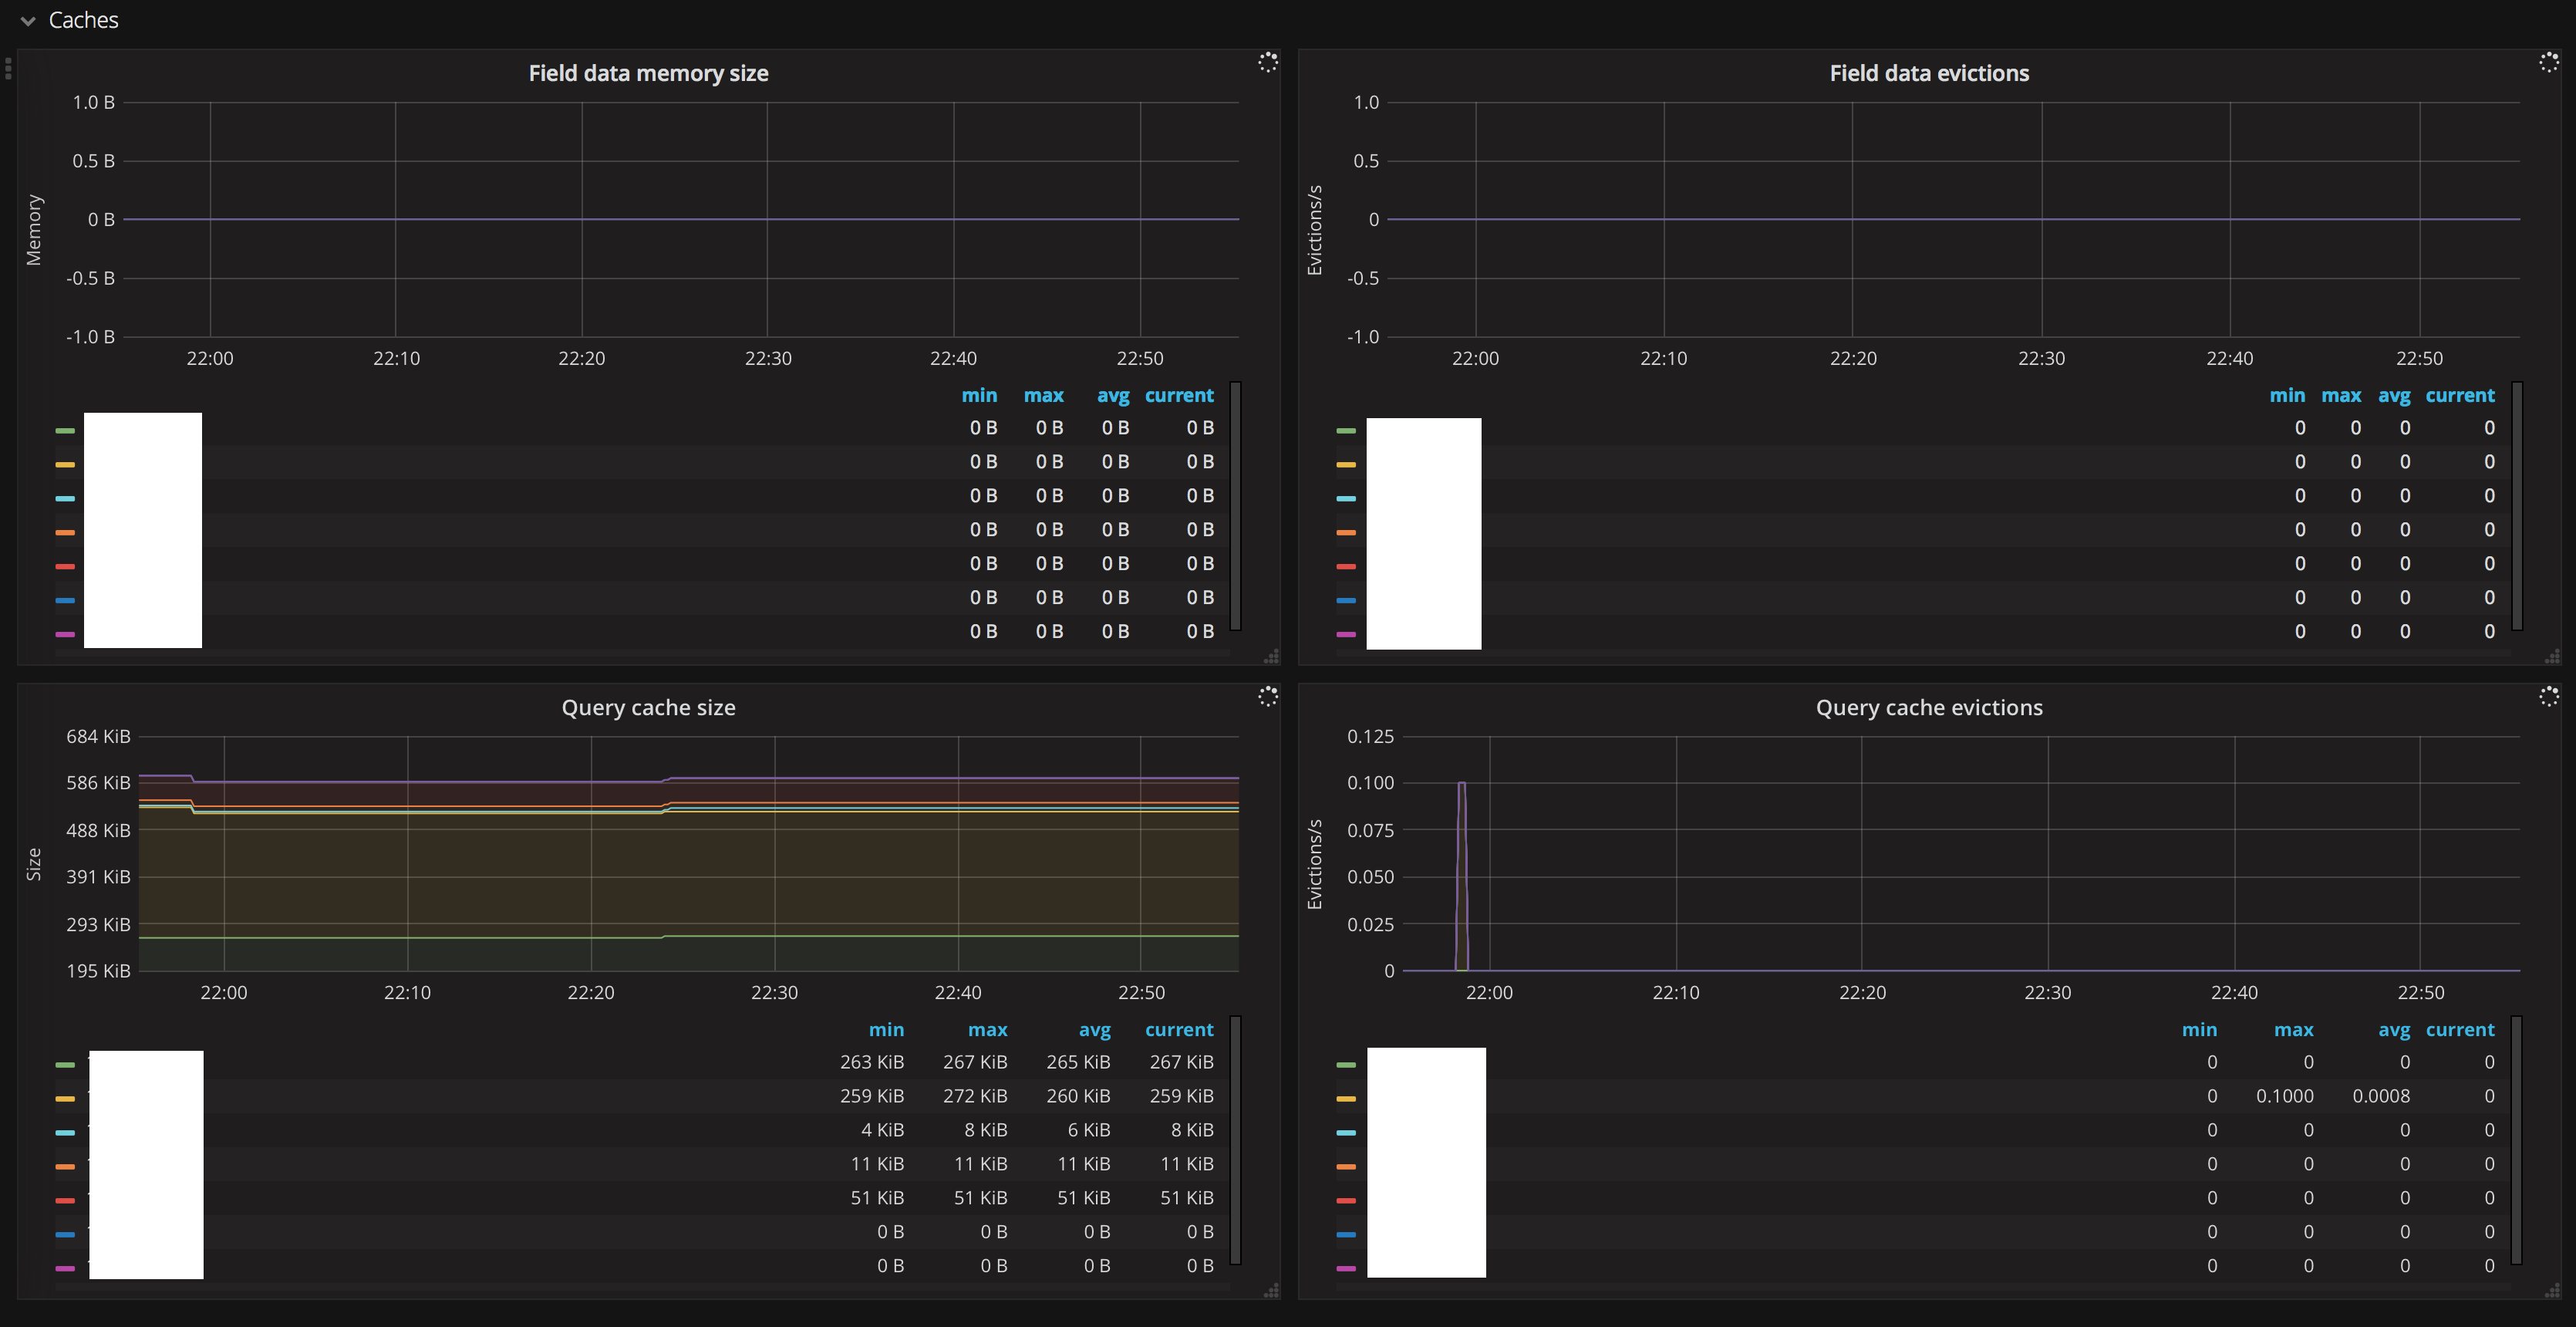
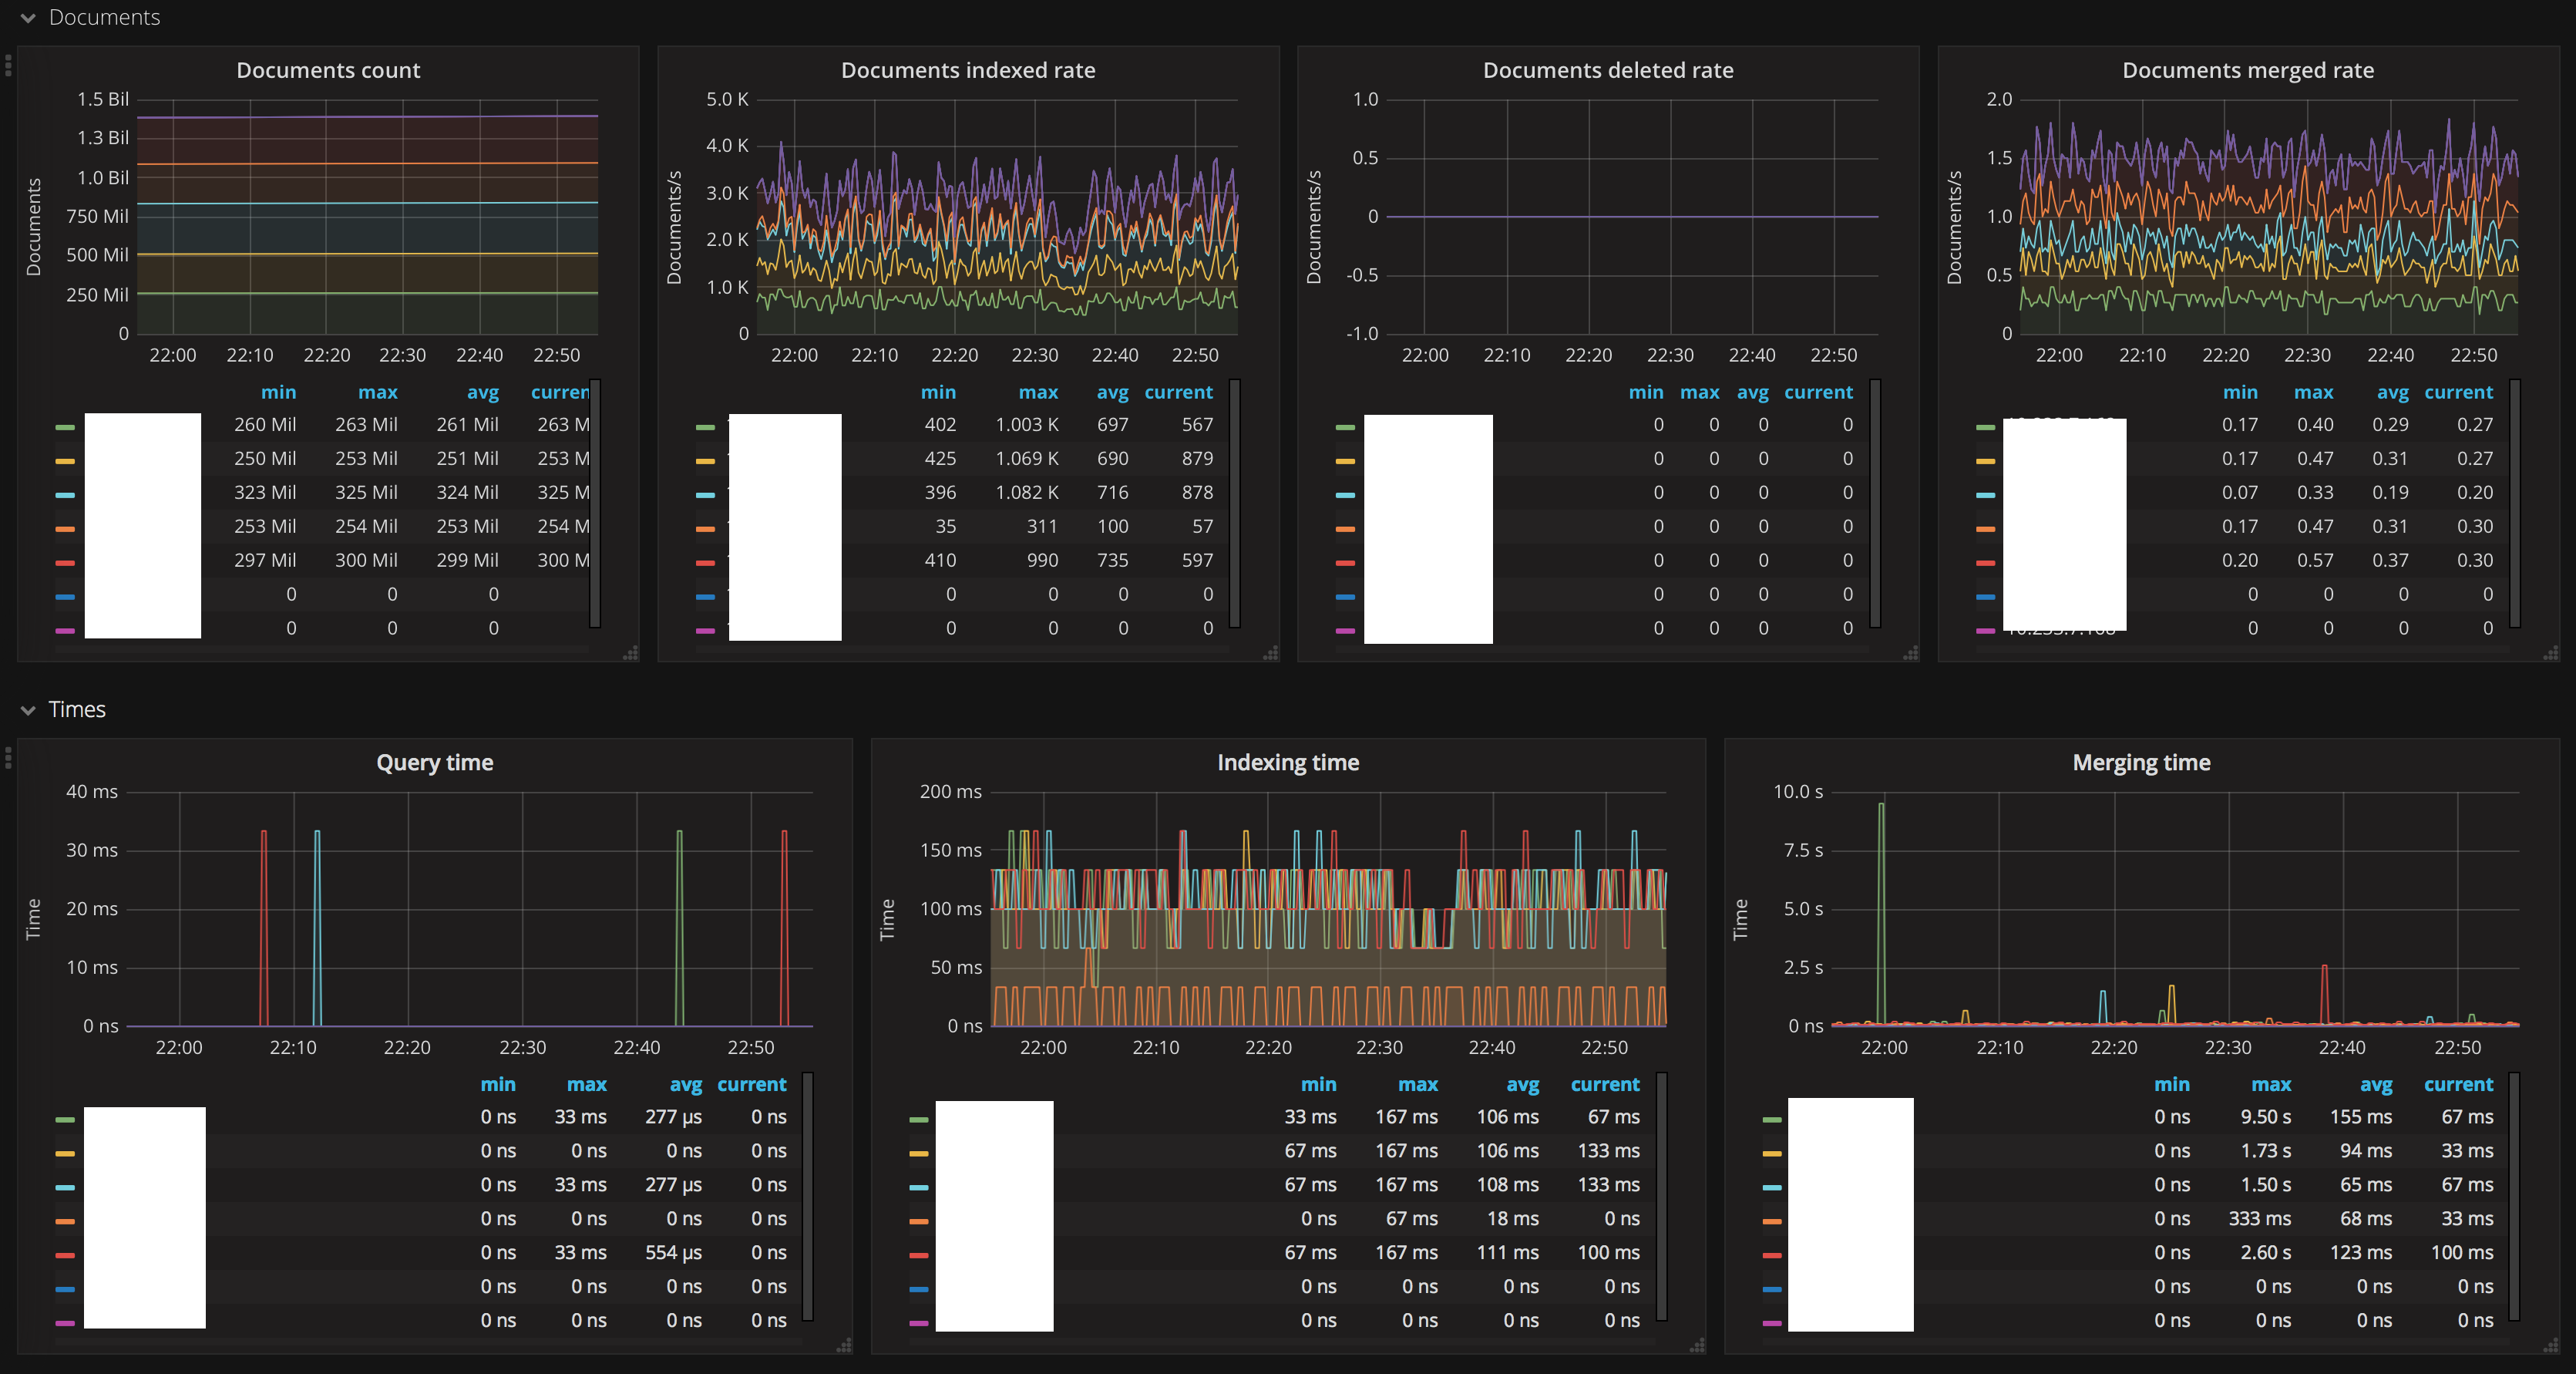
Elasticsearch Stats
2,566

Created 5/26/2017
Updated 6/16/2017
Revision 2
Categories
Elasticsearch
Grafana Version >=4.2.0
Datasources
Prometheus

ElasticSearch metrics from prometheus exporter (https://github.com/justwatchcom/elasticsearch_exporter)

Fork from: https://grafana.com/dashboards/266

git: https://github.com/yackushevas/grafana_dashboards

rev2: Update for compatibility with 0.3.3 elasticsearch_exporter: https://github.com/justwatchcom/elasticsearch_exporter/releases/tag/v0.3.3 Added labels for dividing nodes by type: https://www.elastic.co/guide/en/elasticsearch/reference/current/modules-node.html for example:

- job_name: 'elasticsearch'

  scrape_interval: 30s
  metrics_path: '/metrics'
  static_configs:
    - targets: [ 'master1']
      # Labels assigned to all metrics scraped from the targets.
      labels:
        node_type: data
    - targets: [ 'storage1' ]
      # Labels assigned to all metrics scraped from the targets.
      labels:
        node_type: master
    - targets: [ 'client1' ]
      # Labels assigned to all metrics scraped from the targets.
      labels:
        node_type: client"
Get Dashboard
Download
Copy to Clipboard
Source Grafana.com