ElasticSearch 1,357,1351,357,135 3.0 (1 reviews)
8/2/2016
7/9/2017
4
Elasticsearch
>=4.4.1
Prometheus
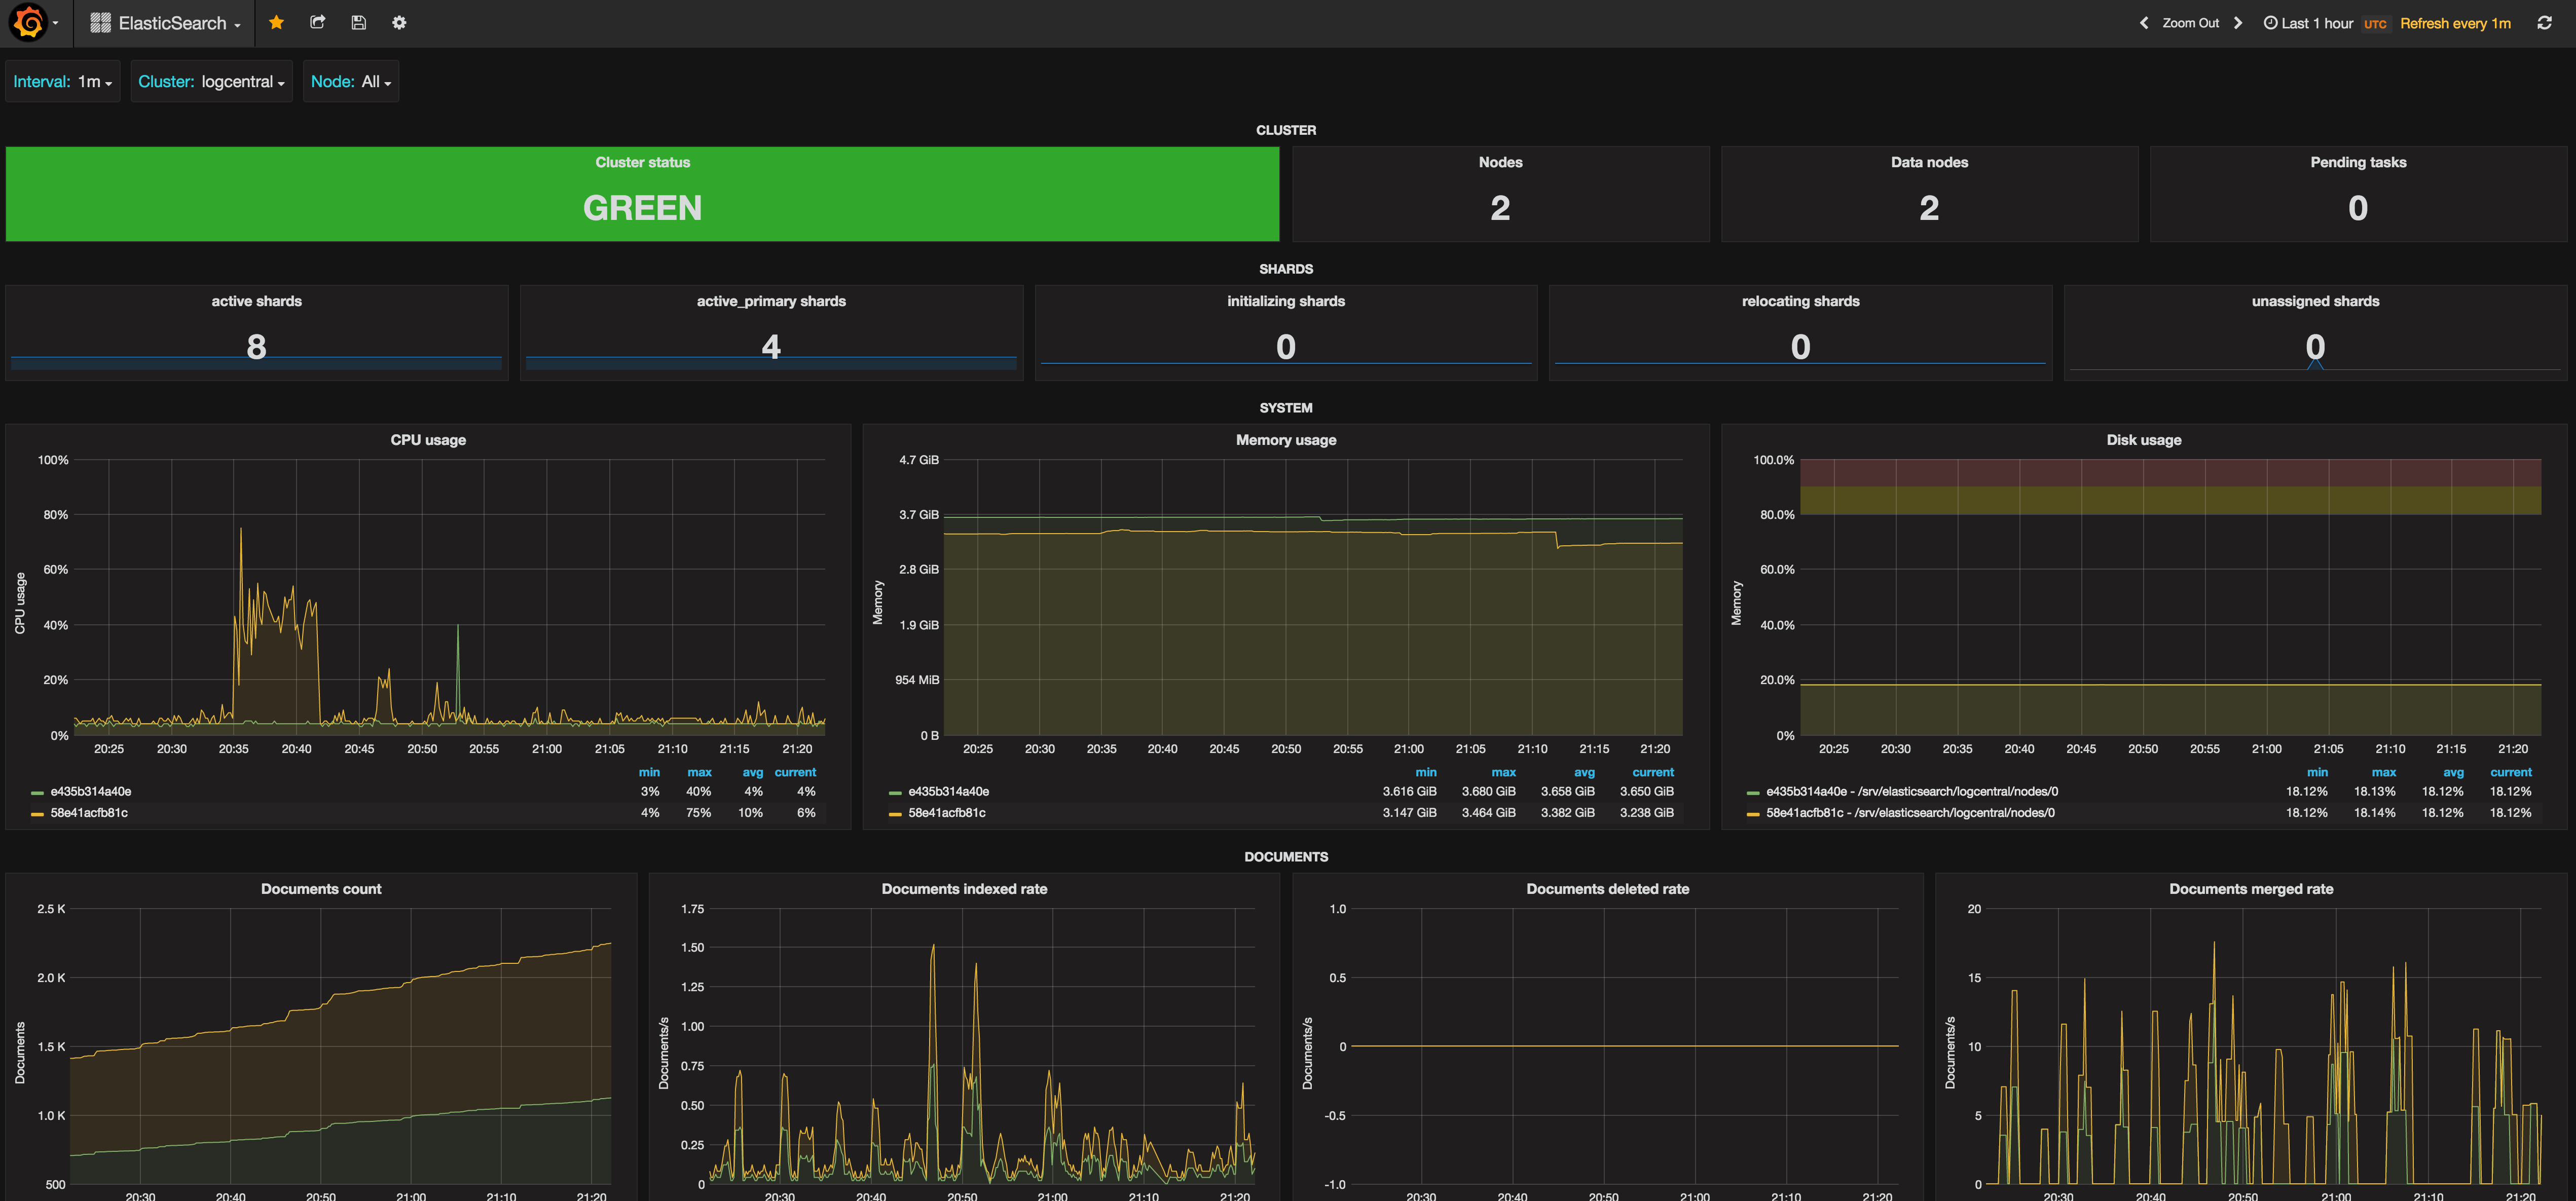
Description
Monitors Elasticsearch performance and health by aggregating key node and cluster metrics to identify latency, throughput, and reliability issues. It typically highlights node_cpu_seconds_total or similar CPU metrics, elasticsearch_cluster_status or equivalent for health, and indices_docs_count/indexing_rate to reveal indexing throughput and data growth. *The panels are designed to surface anomalies quickly with alerting-ready thresholds and trend-based visualizations to track variance over time.
Screenshots
Get Dashboard✕
Download
Copy to Clipboard