ElasticSearch 93,09693,096 3.8 (5 reviews)
5/24/2017
4/6/2018
4
Elasticsearch
>=4.6.2
Prometheus
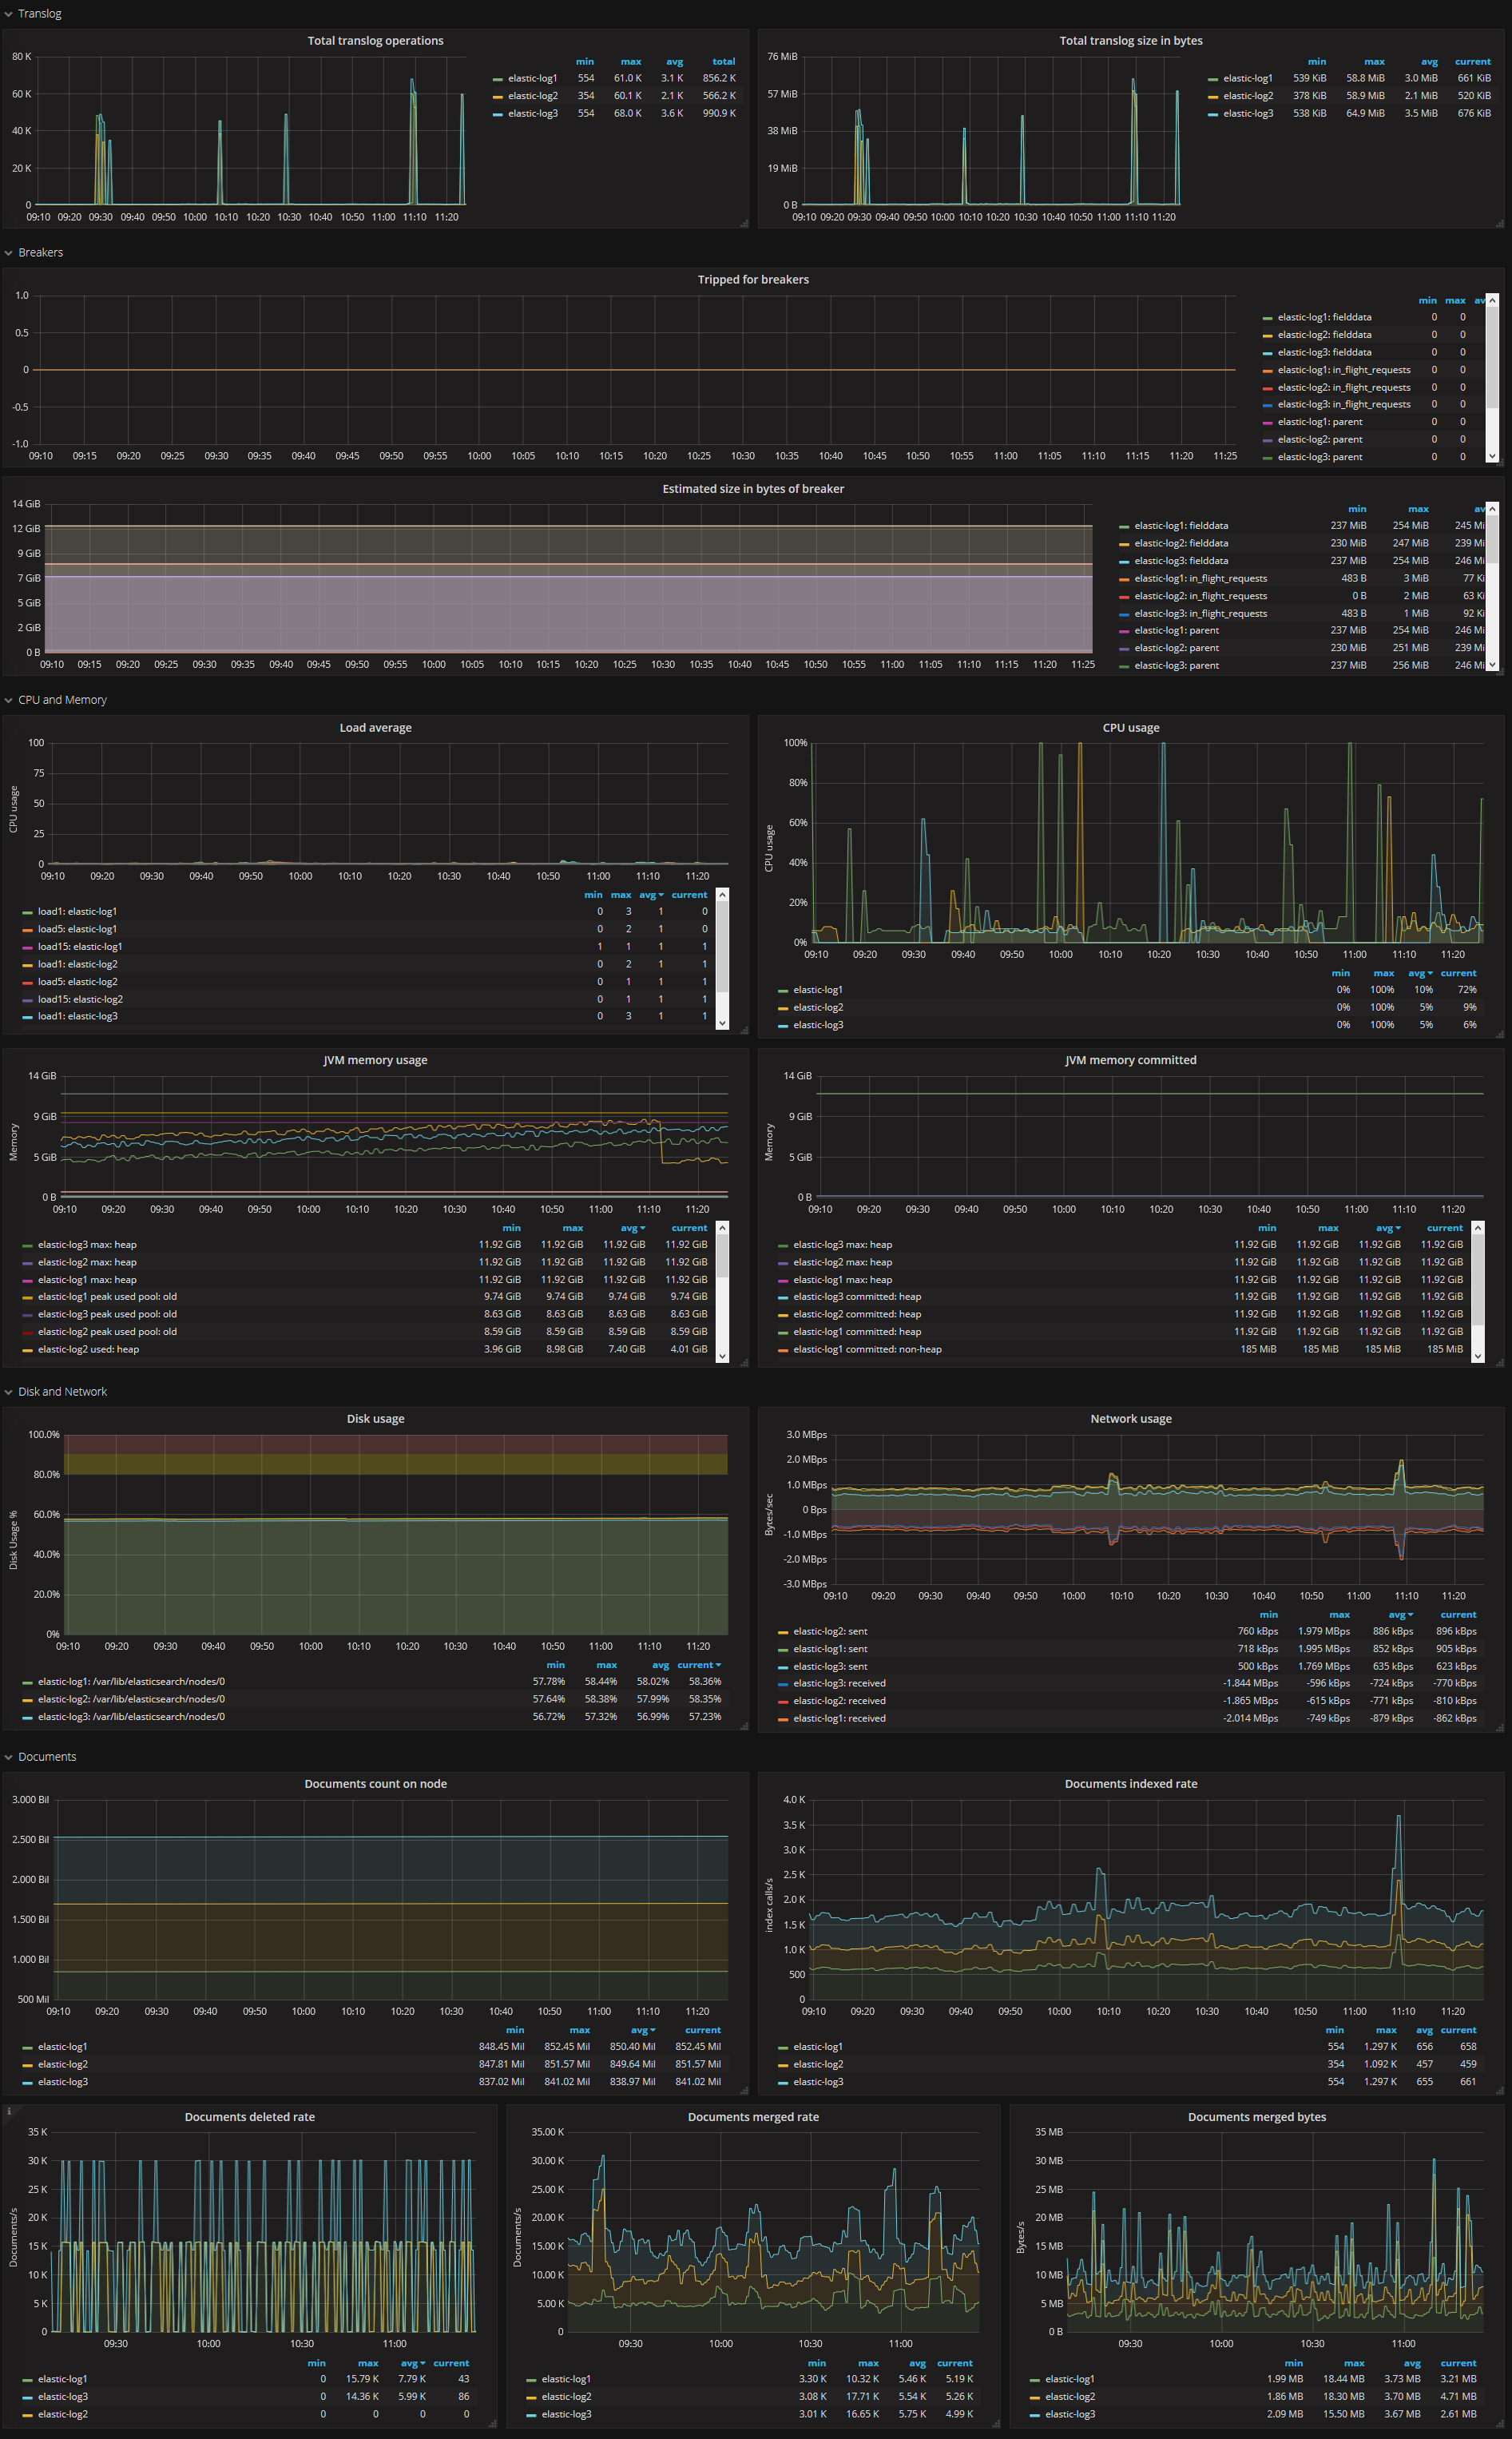
Description
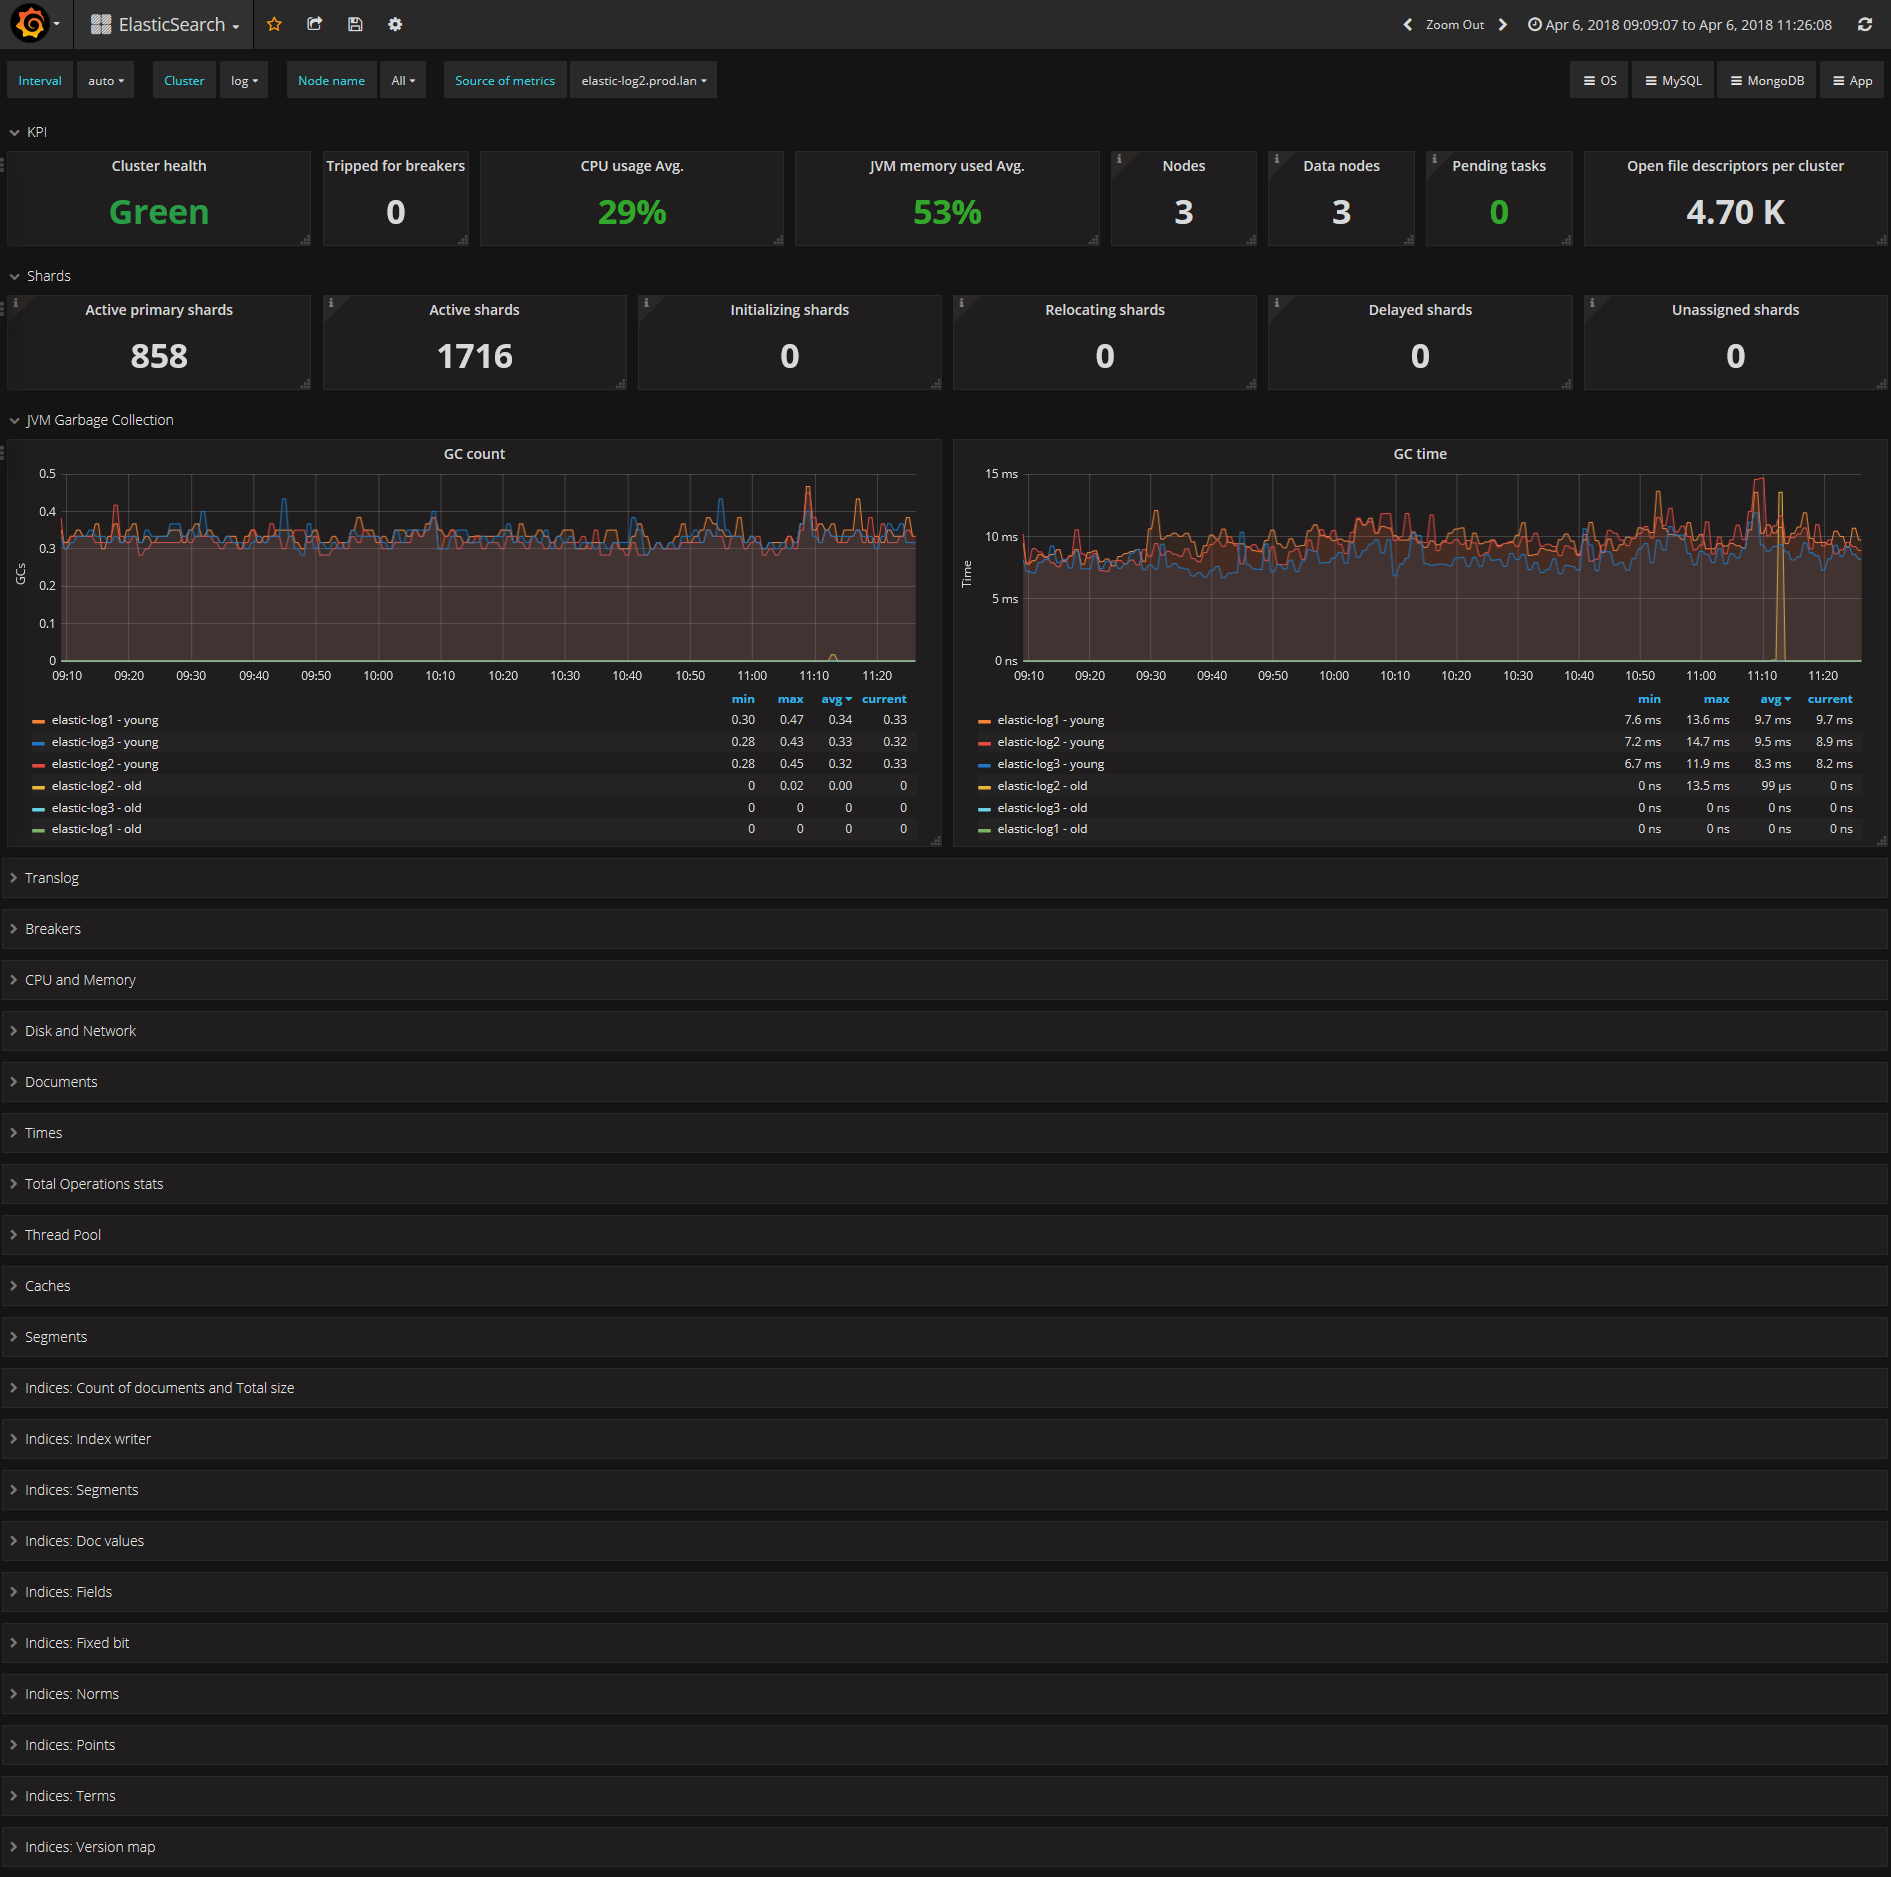
This dashboard monitors Elasticsearch cluster health and performance with a focus on latency, resource utilization, and indexing efficiency. It highlights key metrics such as http_latency_ms (or equivalent per-request latency), node_cpu_seconds_total (CPU usage), and indexing_rate_docs_per_sec to provide immediate visibility into bottlenecks and overall throughput. Panels typically integrate alerting thresholds and time-series comparisons to track trends, enabling quick diagnosis of degraded search performance or shard/node issues.
Screenshots
Get Dashboard✕
Download
Copy to Clipboard