EKS Control Plane 3,5243,524
6/2/2024
6/4/2024
1
AWS
>=10.0.2
Prometheus
Description
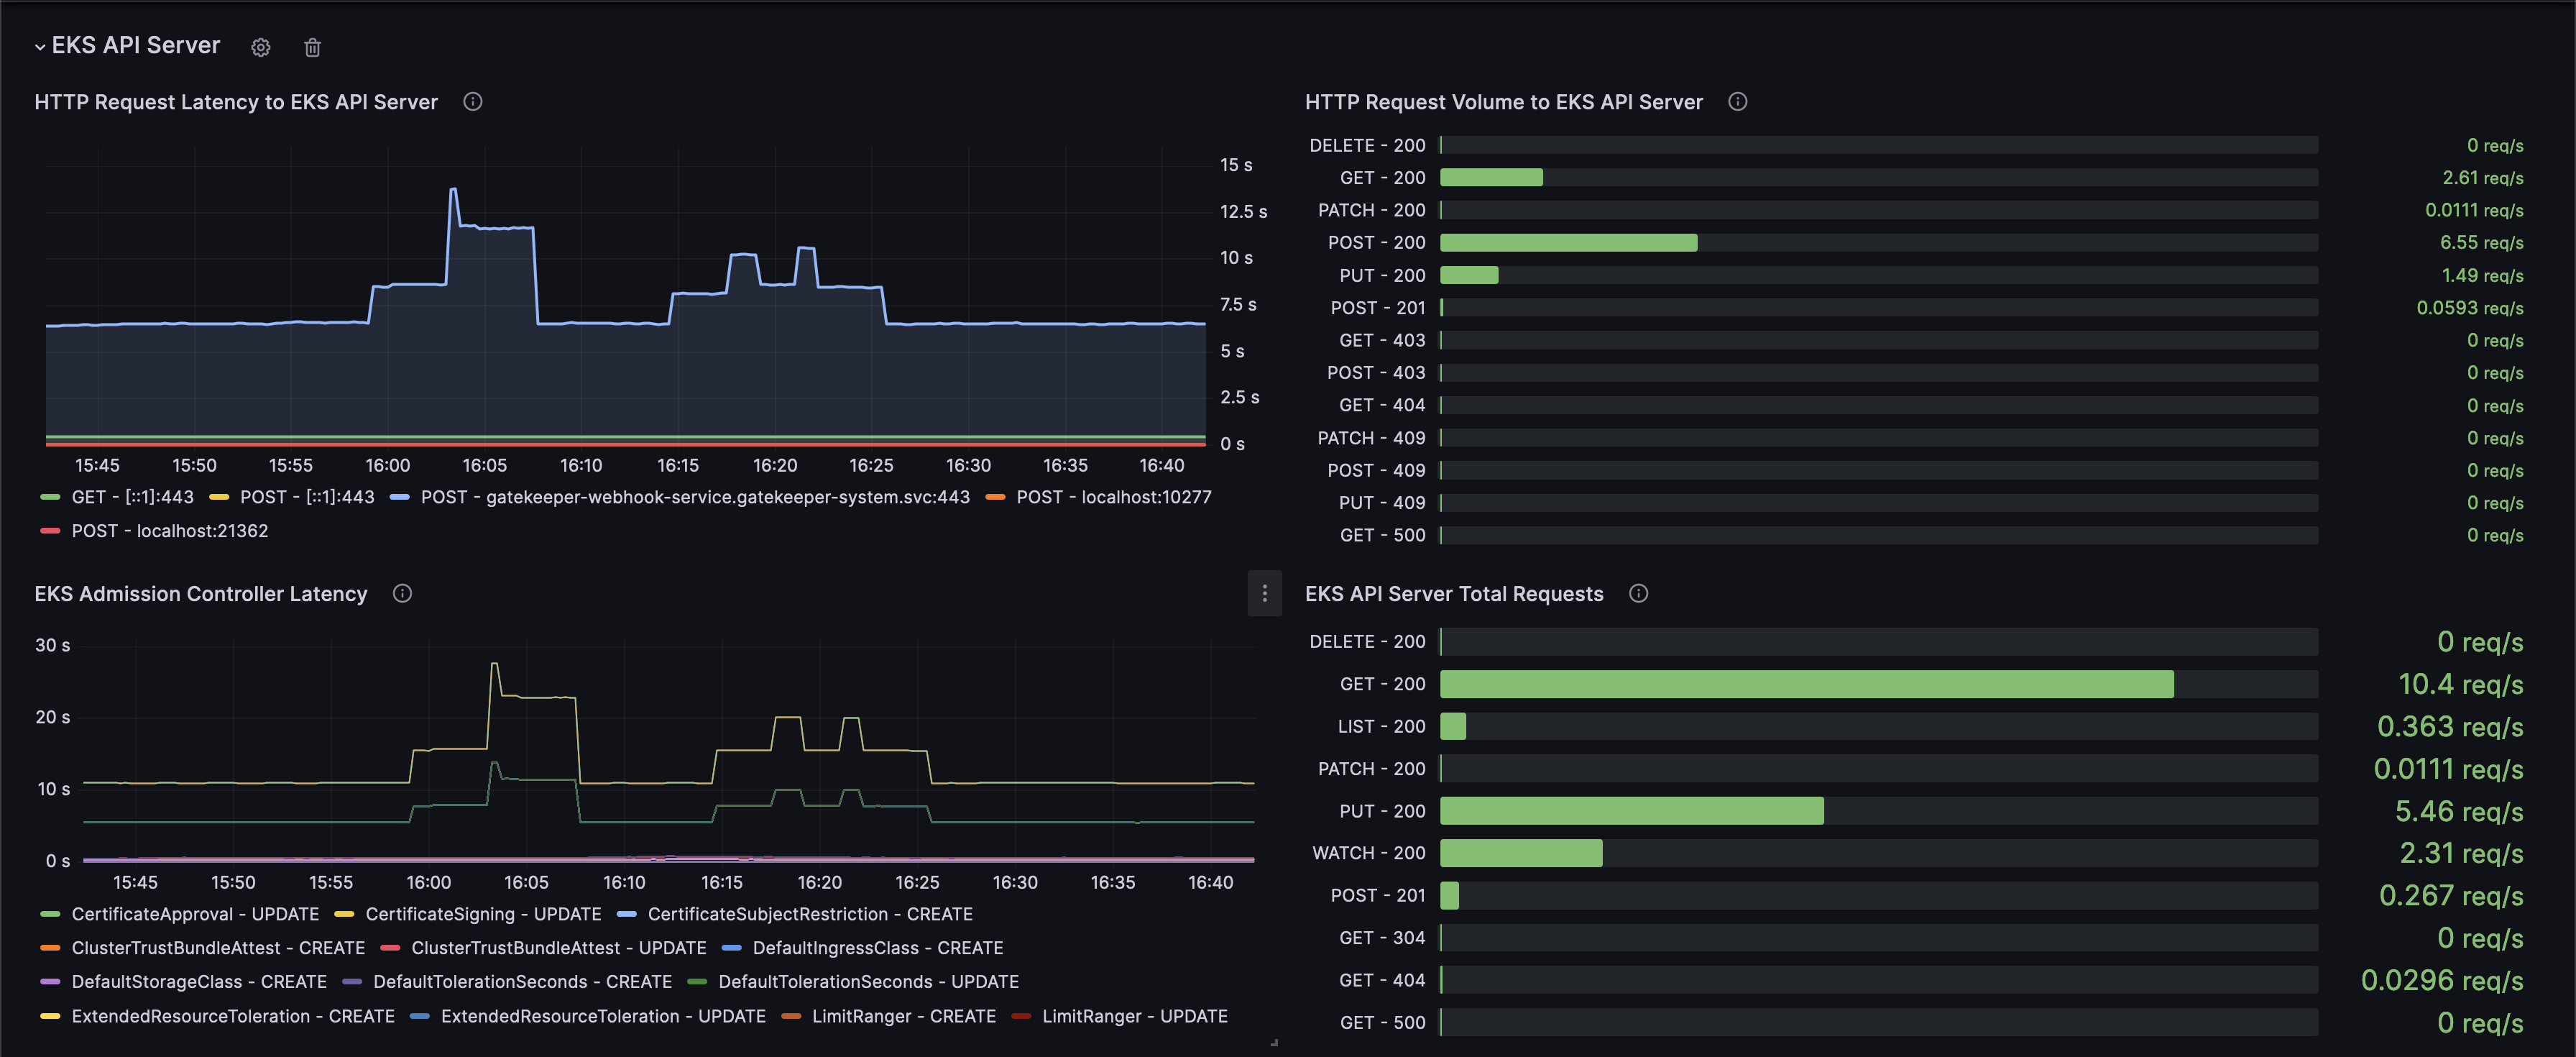
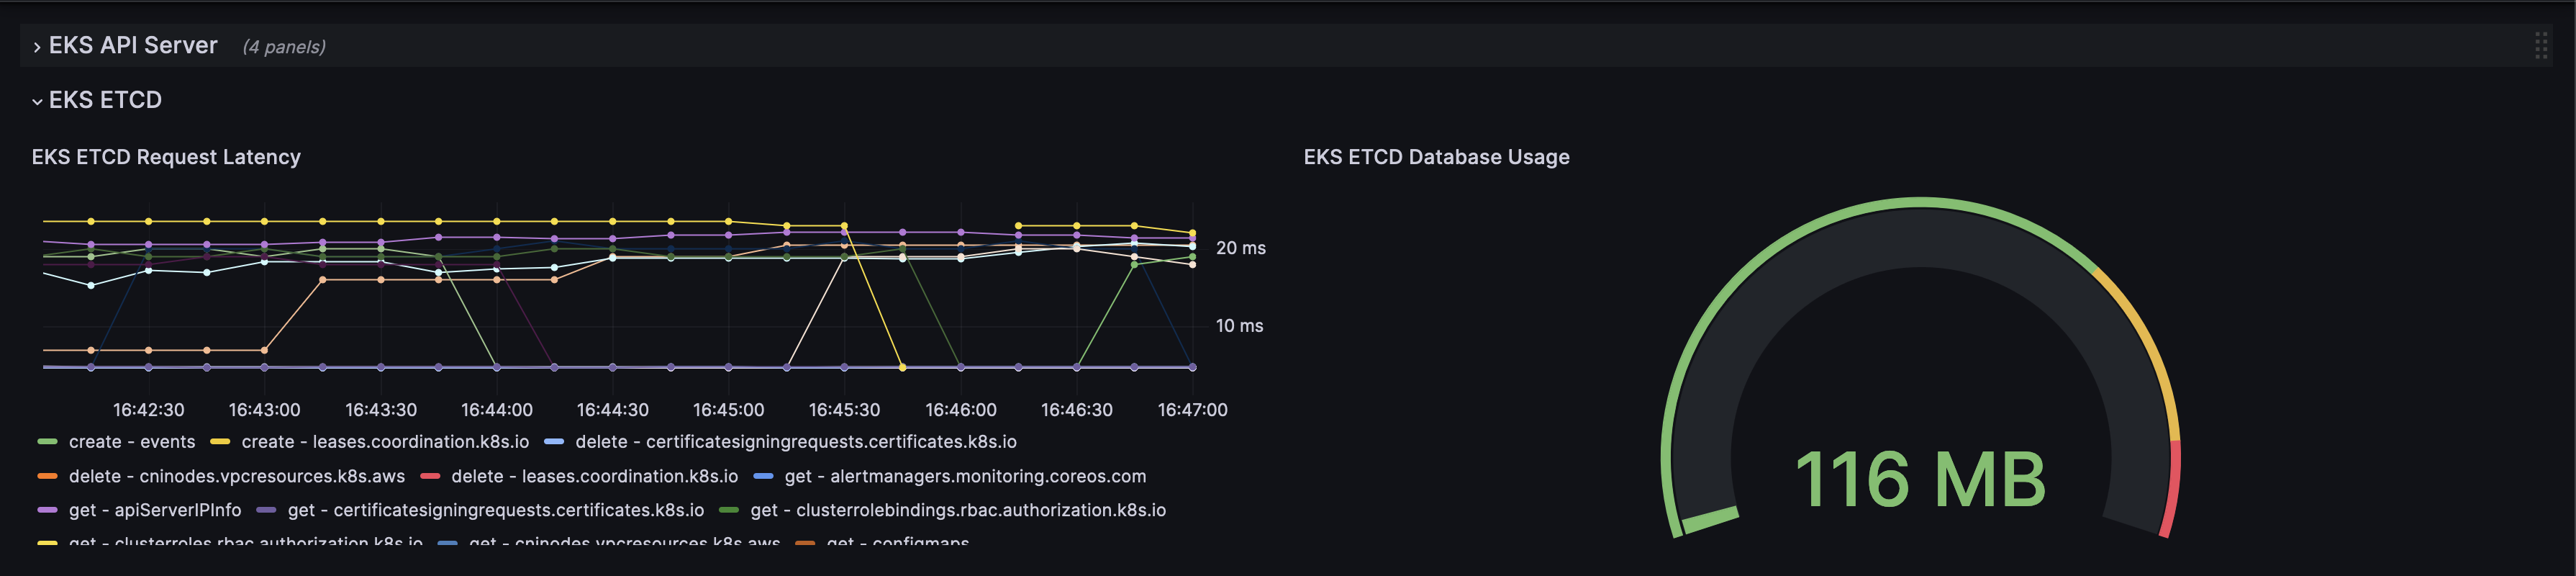
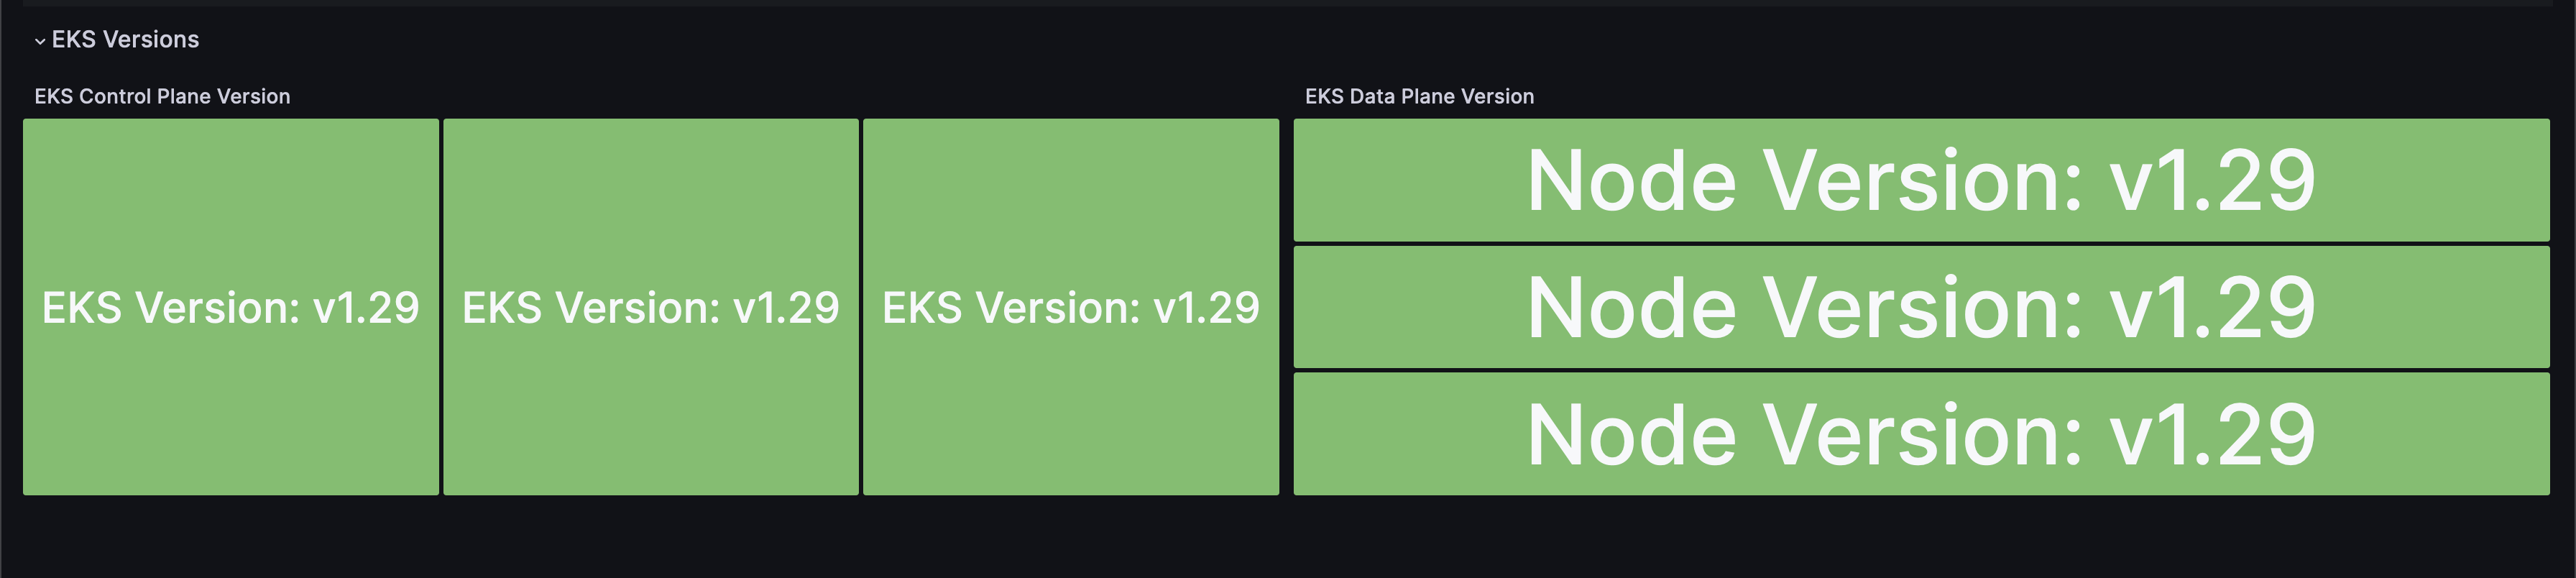
This dashboard graphs EKS Control Plane metrics as described in the EKS best practices guide: https://aws.github.io/aws-eks-best-practices/reliability/docs/controlplane/#monitor-control-plane-metrics.
It tracks API server activity, admission controller performance, client request latencies, and the etcd database size.
Screenshots
Get Dashboard✕
Download
Copy to Clipboard