dotnet-monitor dashboard 3,0873,087
8/3/2023
8/3/2023
1
Azure
>=9.4.12
Prometheus
Description
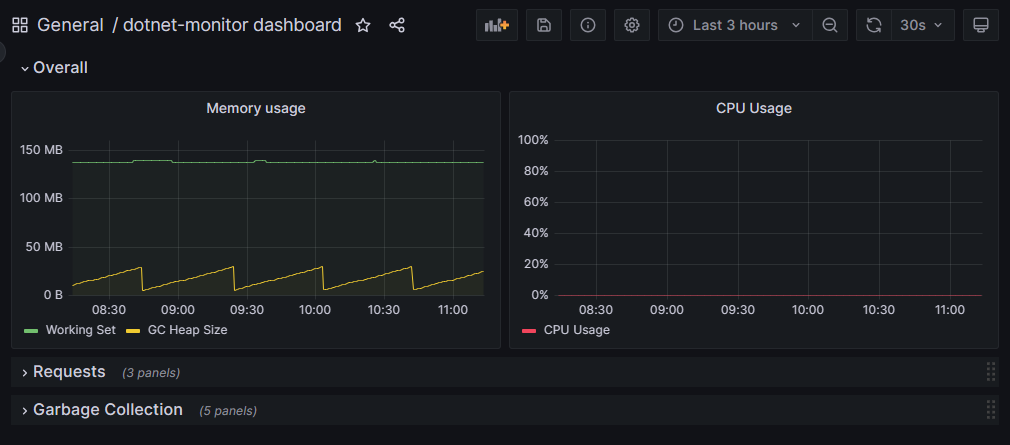
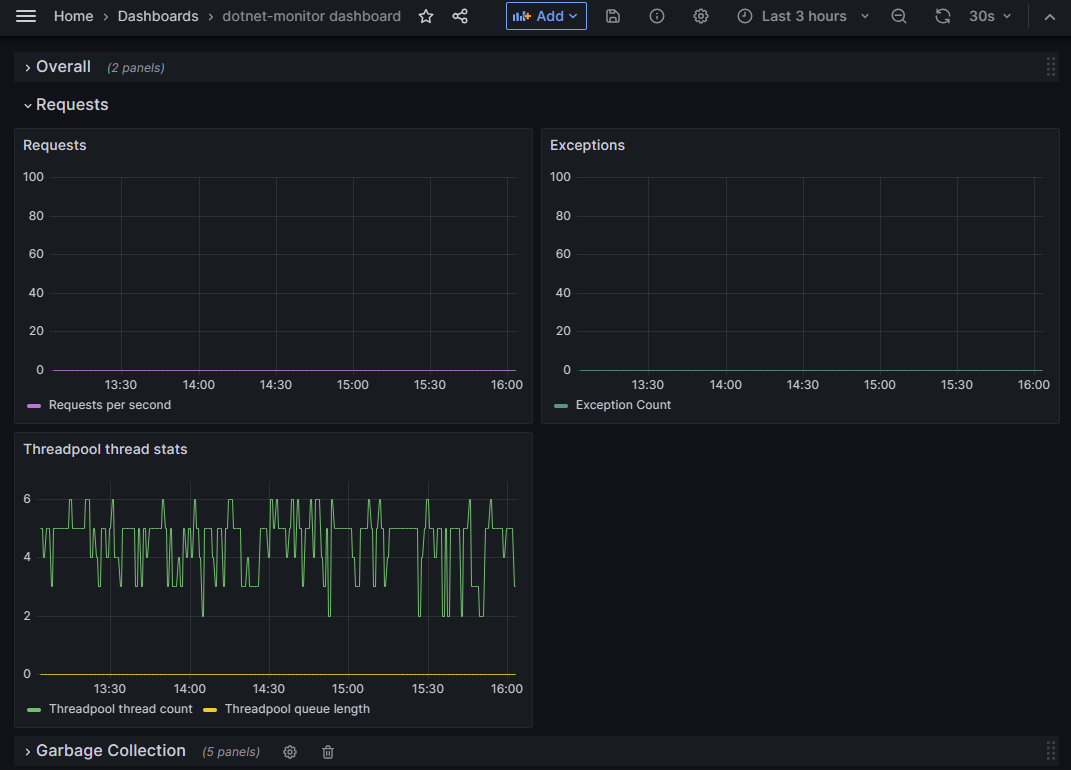
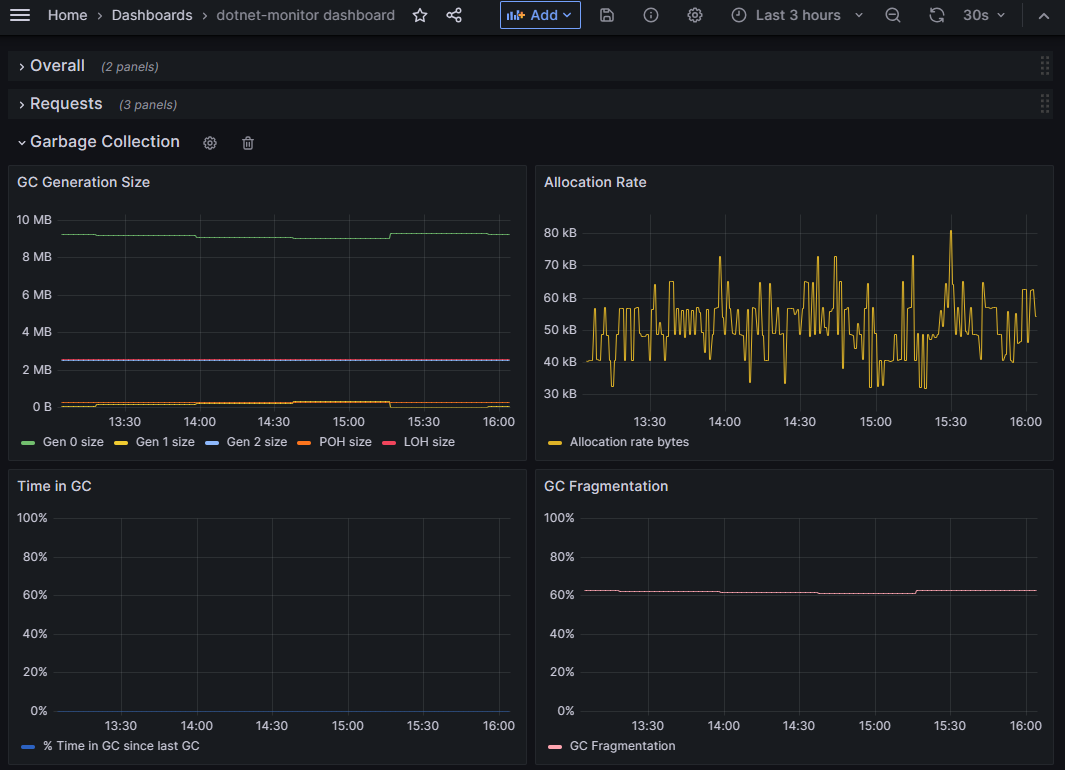
This dotnet-monitor dashboard is designed to show the default .NET metrics scraped using Managed Prometheus on Azure.
Screenshots
Used Metrics 1818
microsoftaspnetcorehosting_requests_per_second
systemruntime_alloc_rate_bytes
systemruntime_cpu_usage_ratio
systemruntime_exception_count
systemruntime_gc_fragmentation_ratio
systemruntime_gc_heap_size_bytes
systemruntime_gen_0_gc_count
systemruntime_gen_0_size_bytes
systemruntime_gen_1_gc_count
systemruntime_gen_1_size_bytes
systemruntime_gen_2_gc_count
systemruntime_gen_2_size_bytes
systemruntime_loh_size_bytes
systemruntime_poh_size_bytes
systemruntime_threadpool_queue_length
systemruntime_threadpool_thread_count
systemruntime_time_in_gc_ratio
systemruntime_working_set_bytes
Get Dashboard✕
Download
Copy to Clipboard