Docker-Swarm-Monitor-v2 2,6042,604 5.0 (1 reviews)
2/15/2017
2/16/2017
2
Docker
>=4.1.1
Prometheus
Description
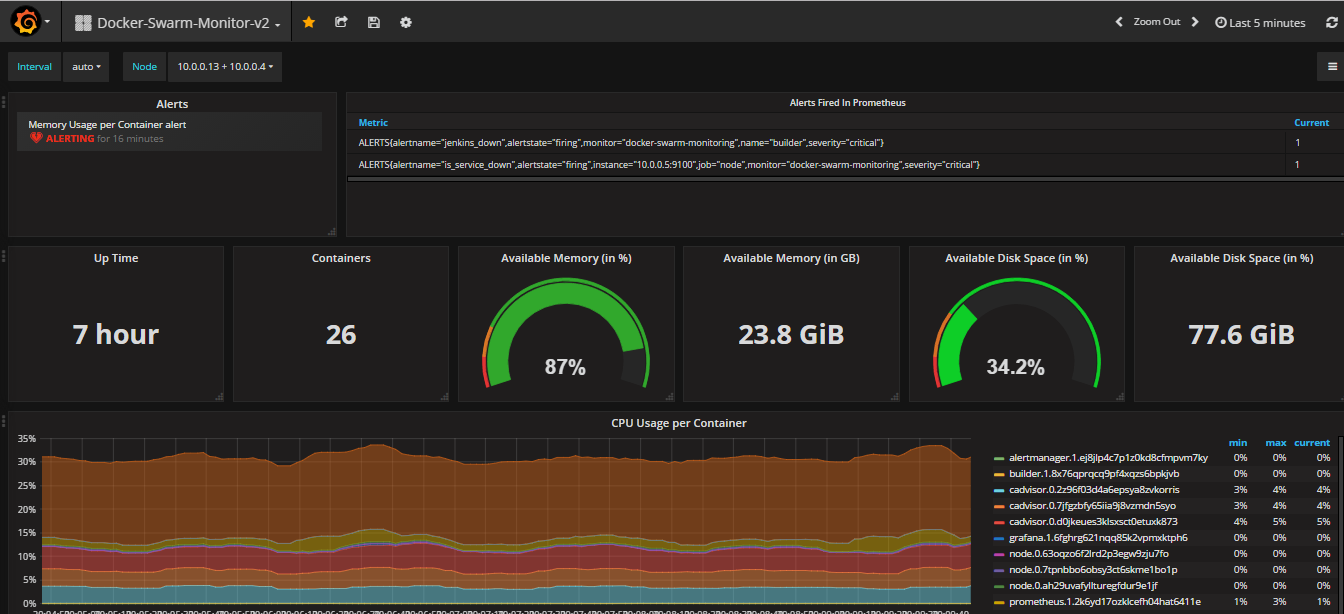
Docker Swarm Monitor Dashboad v2.0
Screenshots
Get Dashboard✕
Download
Copy to Clipboard
Docker Swarm Monitor Dashboad v2.0