Docker Host & Container Overview 16,43216,432 3.0 (1 reviews)
9/7/2016
9/15/2016
1
DockerHost Metrics
>=3.1.1
Prometheus
Description
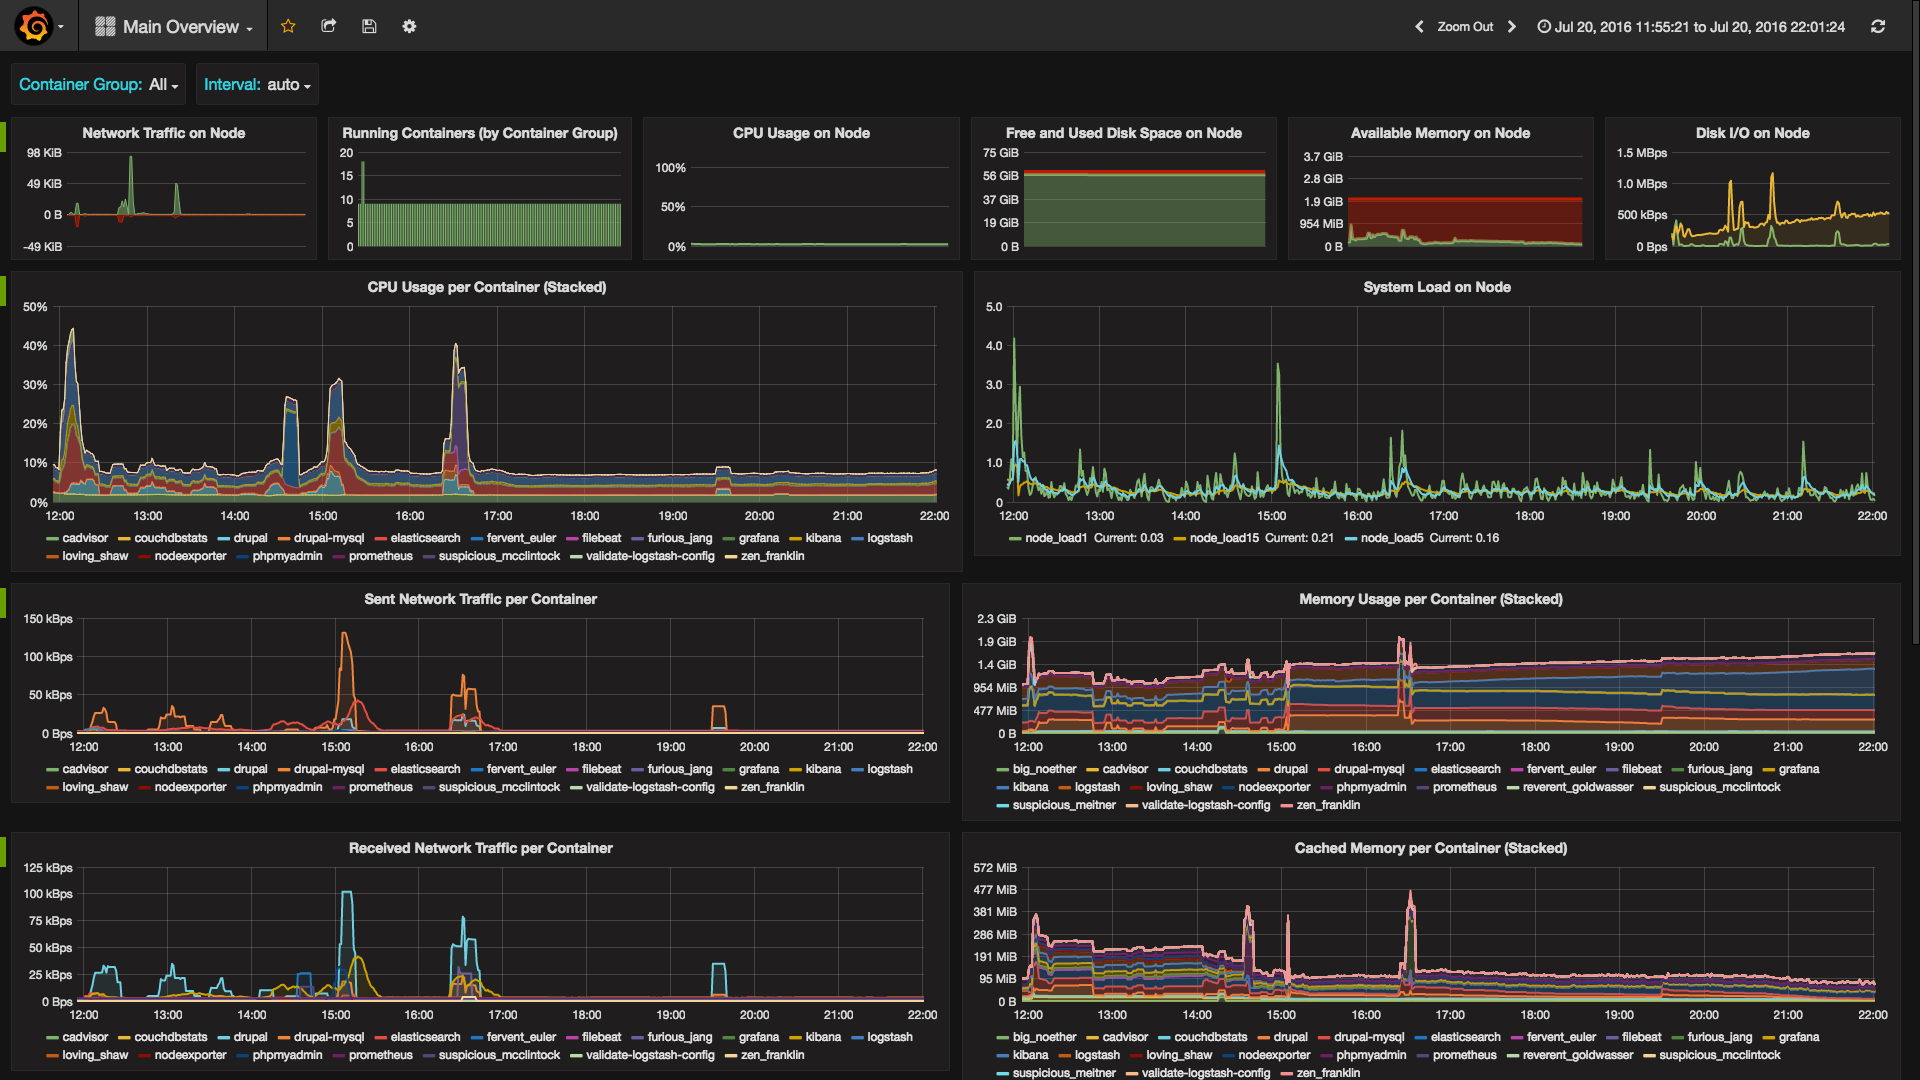
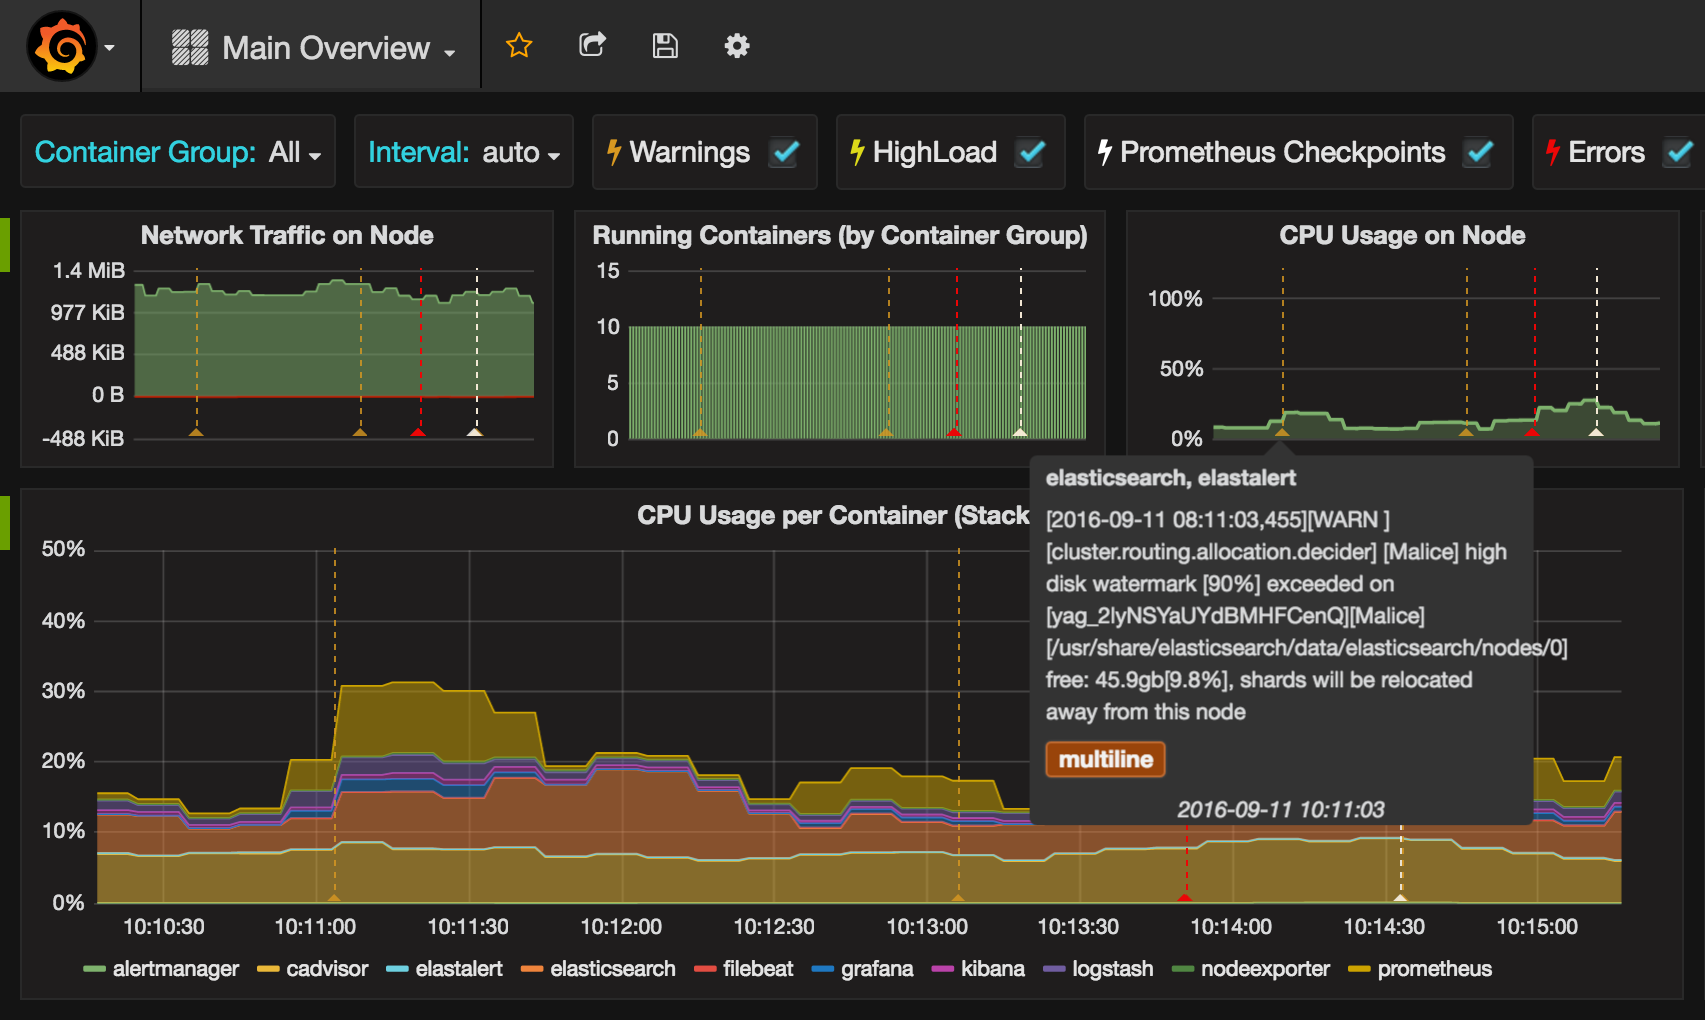
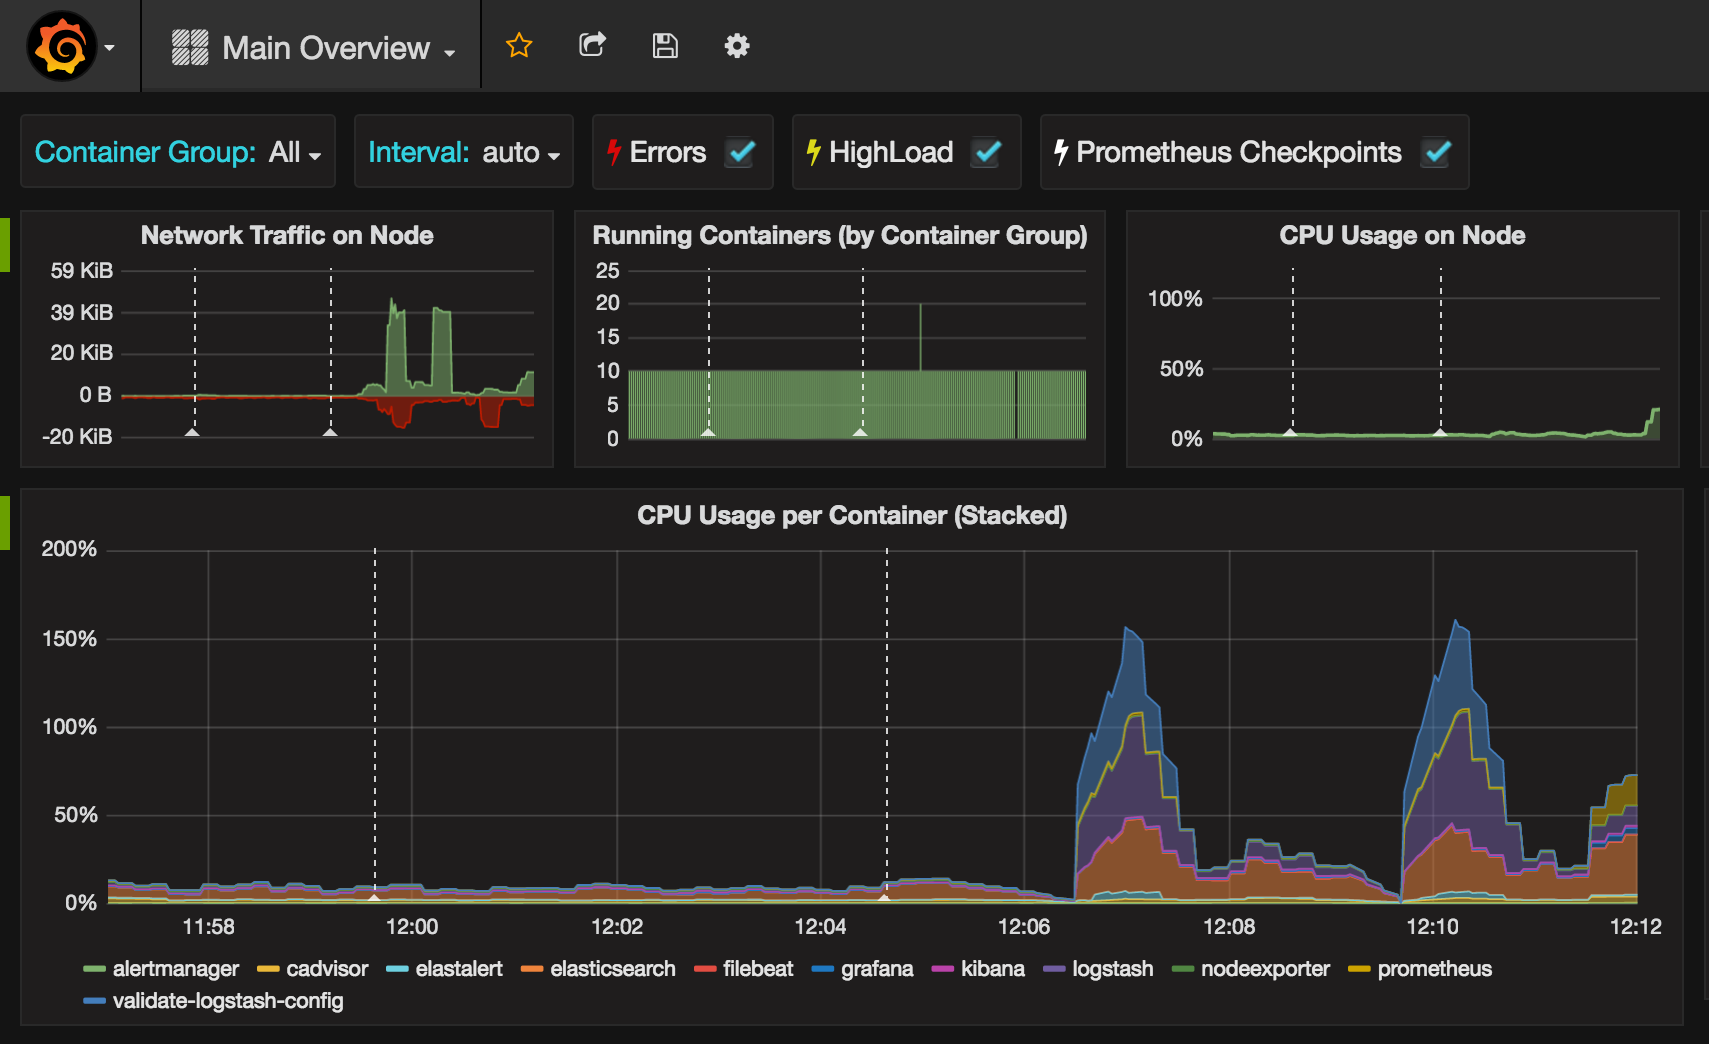
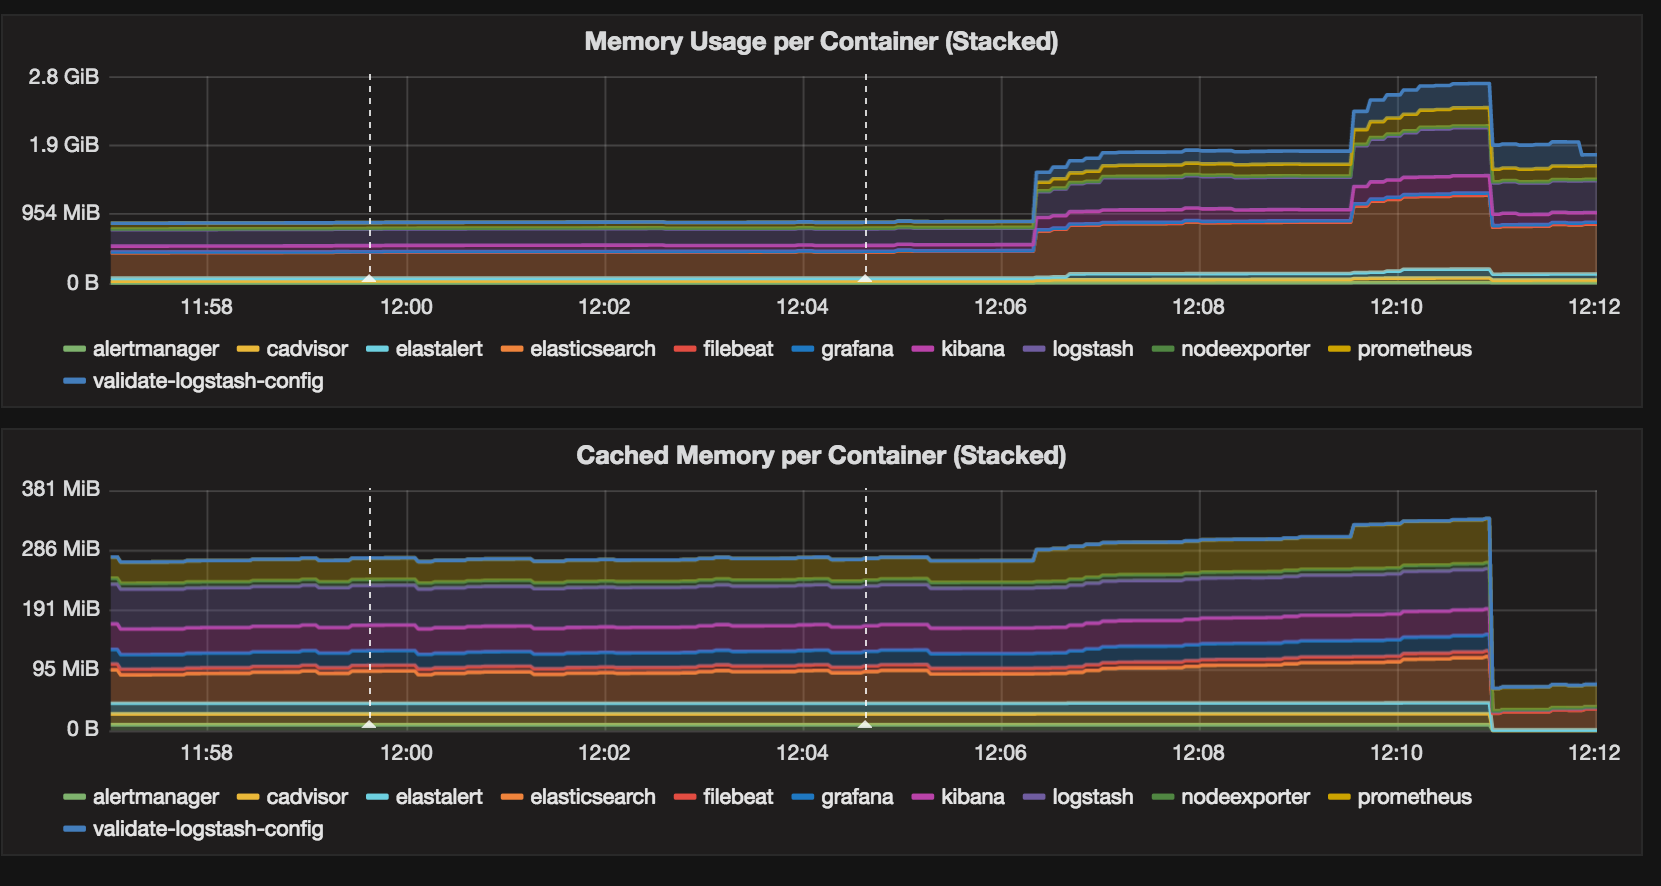
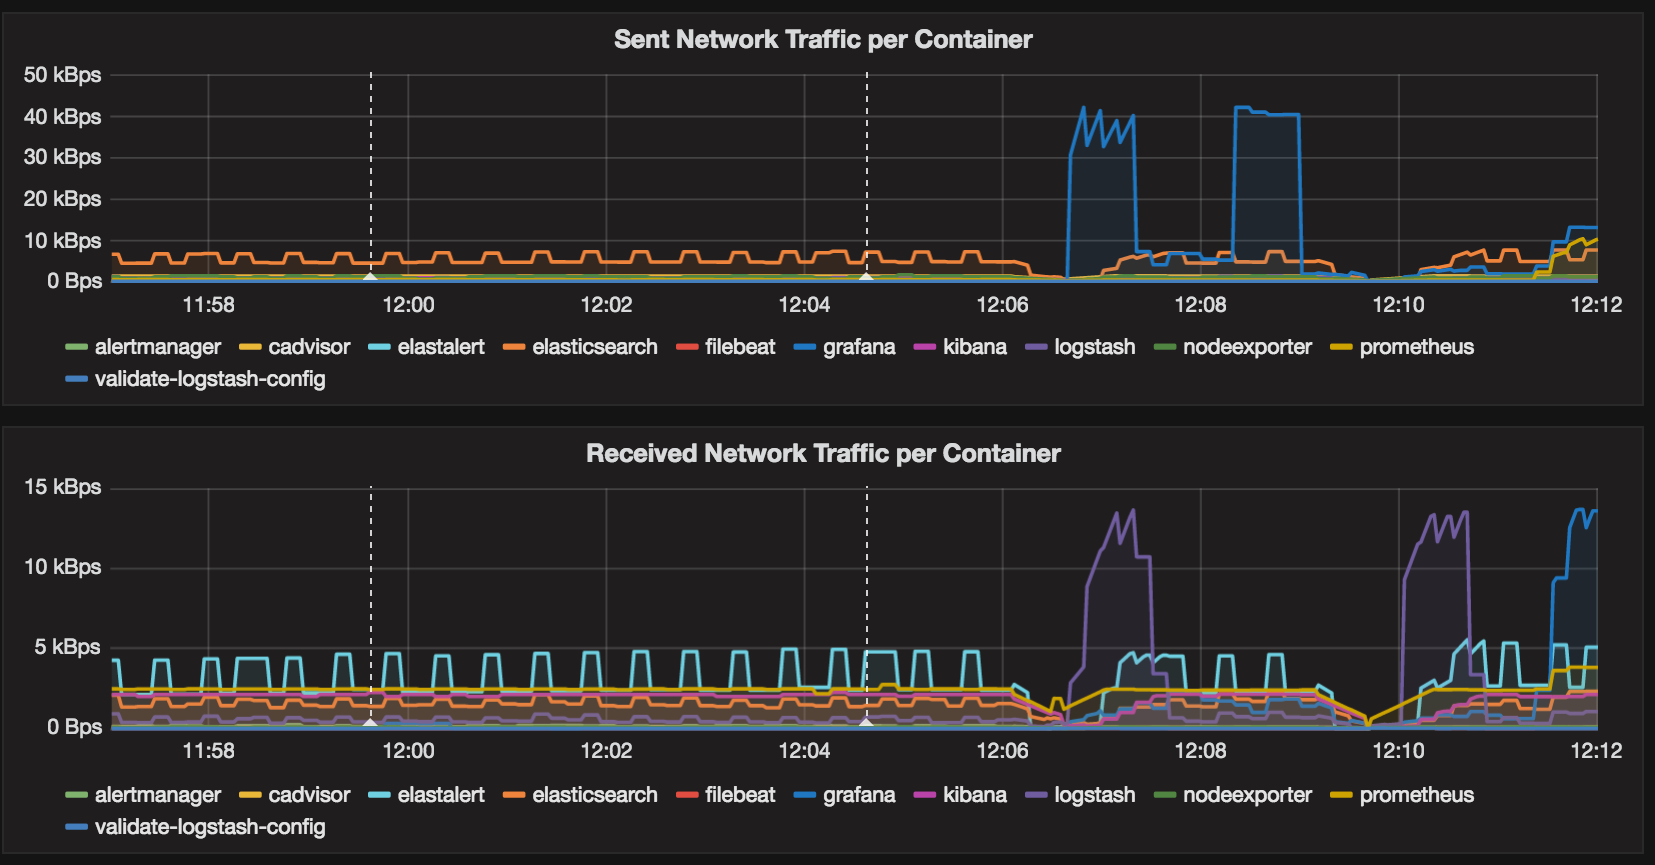
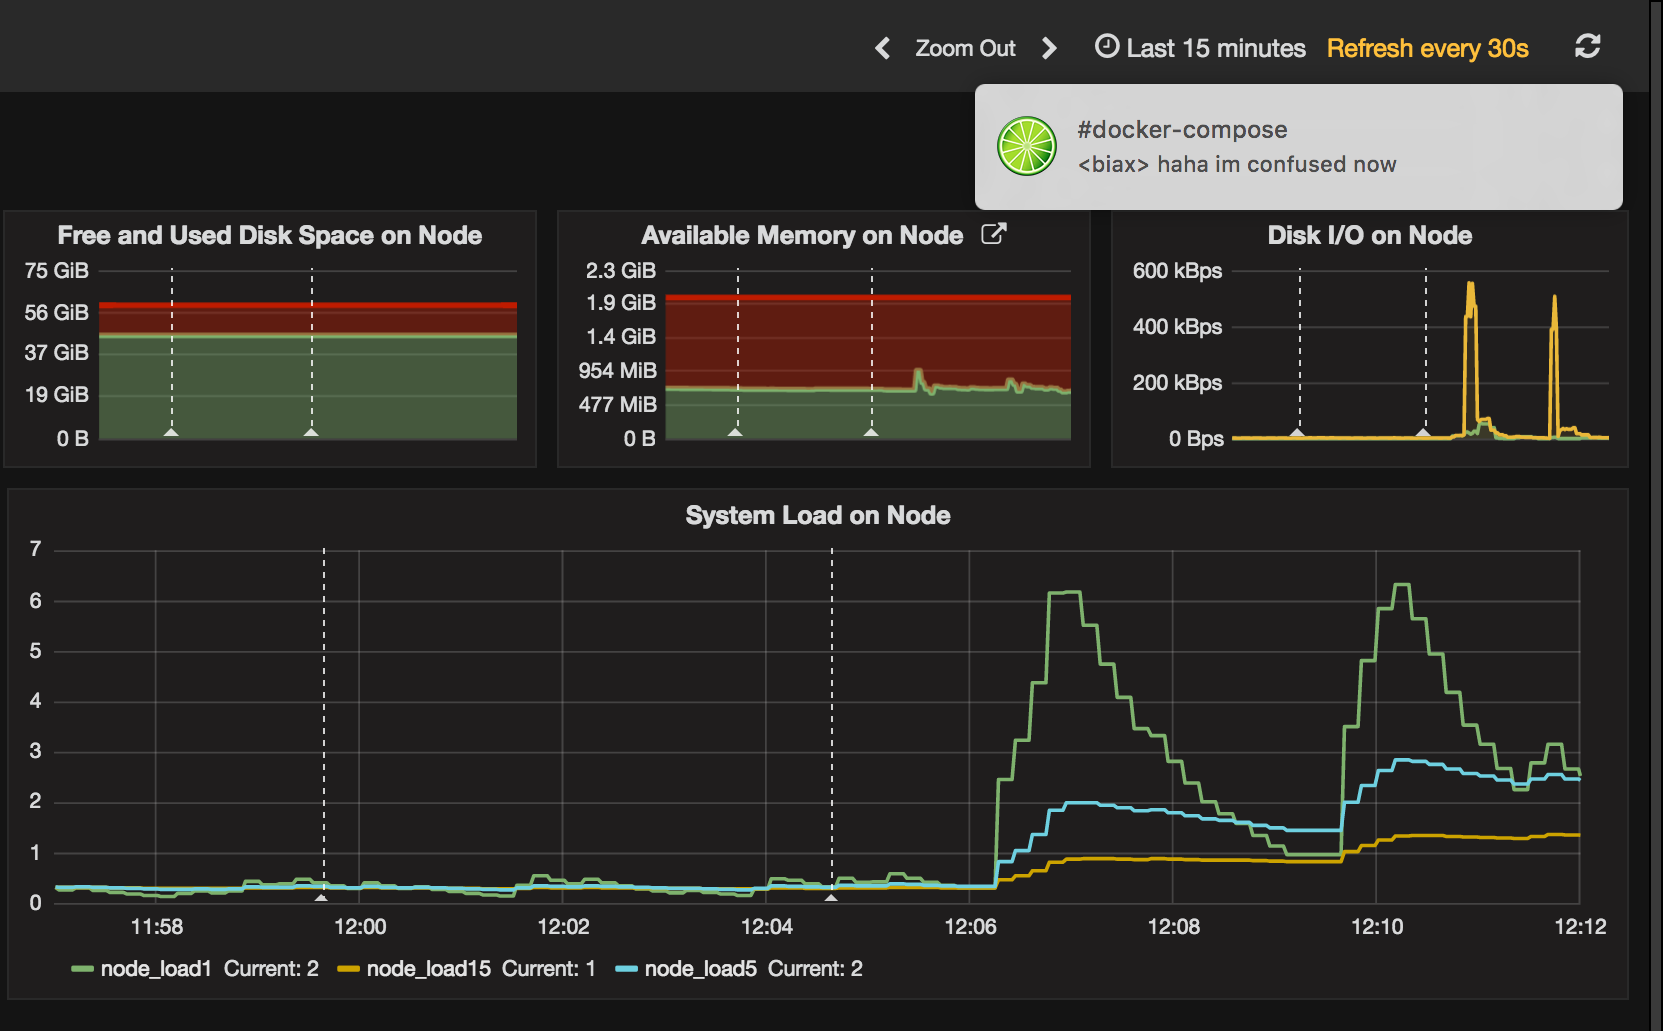
A simple overview of the most important Docker host and container metrics. (cAdvisor/Prometheus)
Screenshots
Get Dashboard✕
Download
Copy to Clipboard