Docker daemon metrics 809809
5/7/2024
5/19/2024
1
Docker
>=10.3.1
Prometheus
Description
Docker daemon (engine) metrics
Screenshots
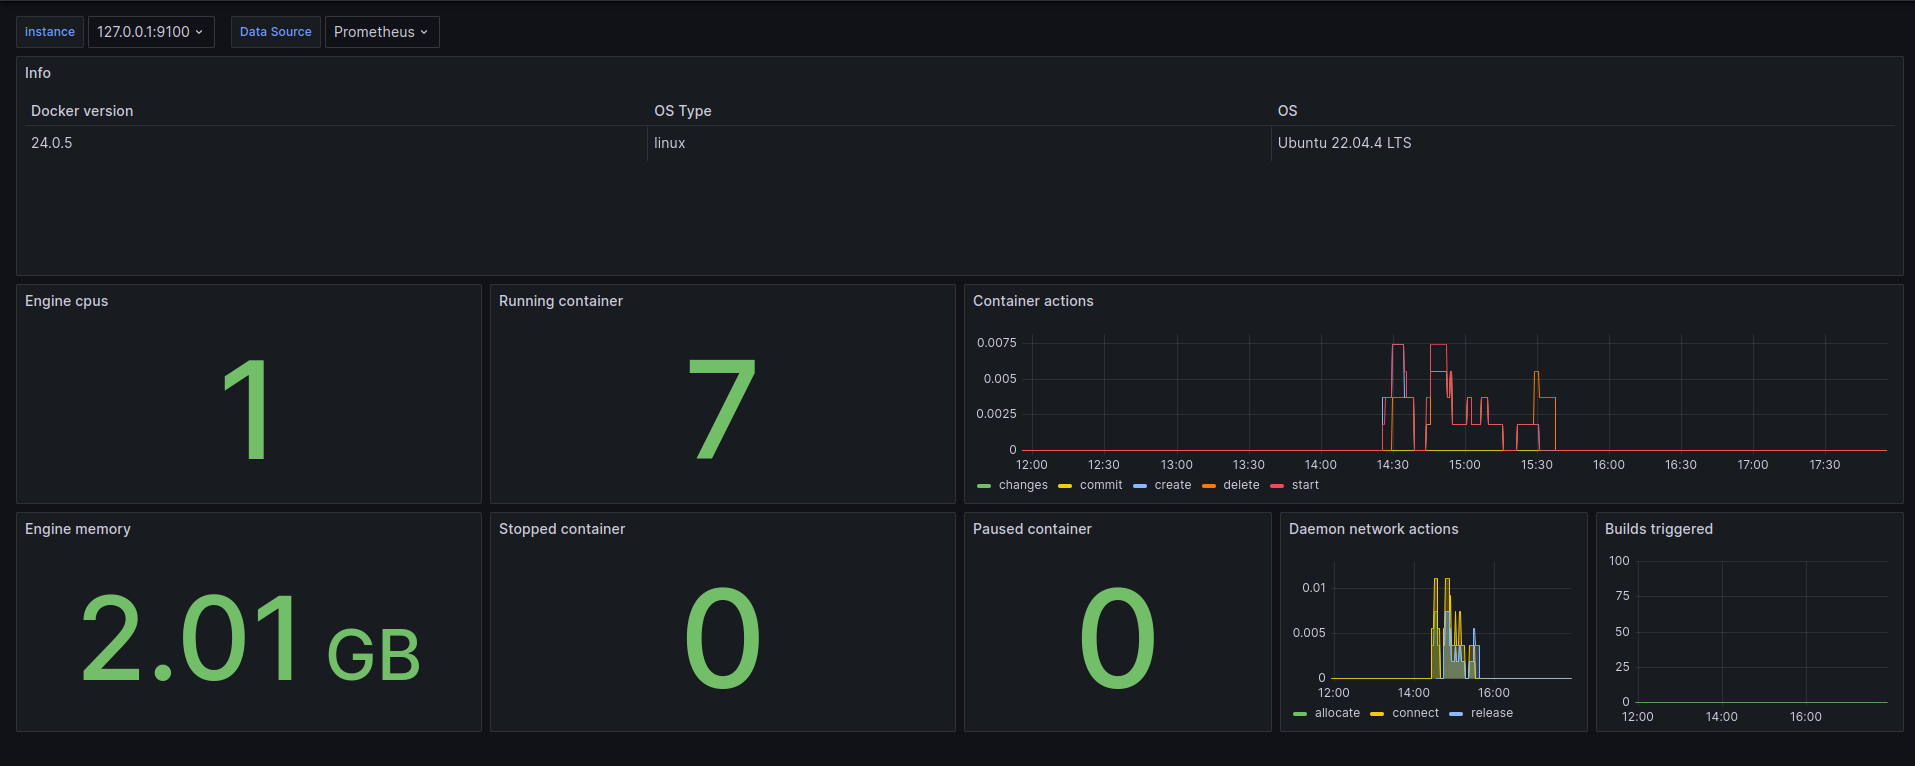
Used Metrics 77
builder_builds_triggered_total
engine_daemon_container_actions_seconds_count
engine_daemon_container_states_containers
engine_daemon_engine_cpus_cpus
engine_daemon_engine_info
engine_daemon_engine_memory_bytes
engine_daemon_network_actions_seconds_count
Get Dashboard✕
Download
Copy to Clipboard