Docker Container & Host Metrics 6,088,7056,088,705 1.5 (2 reviews)
Description
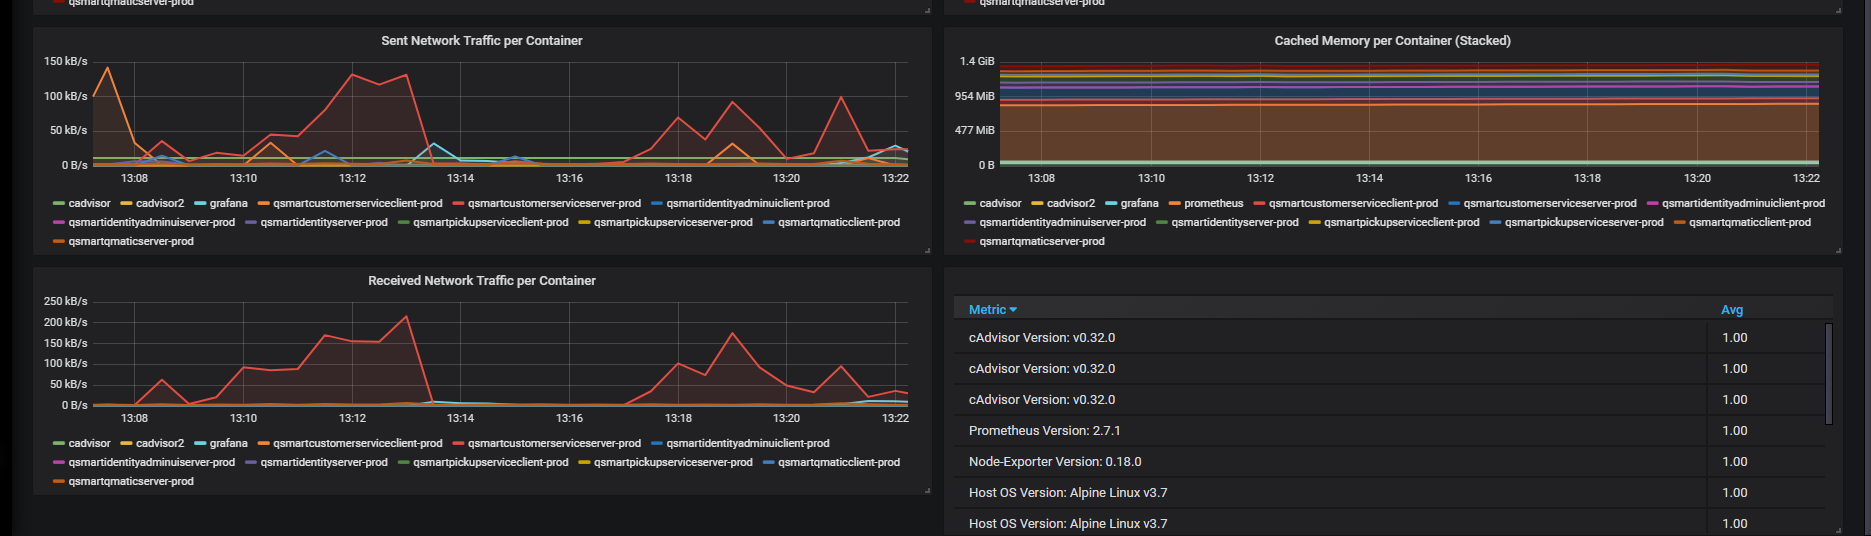
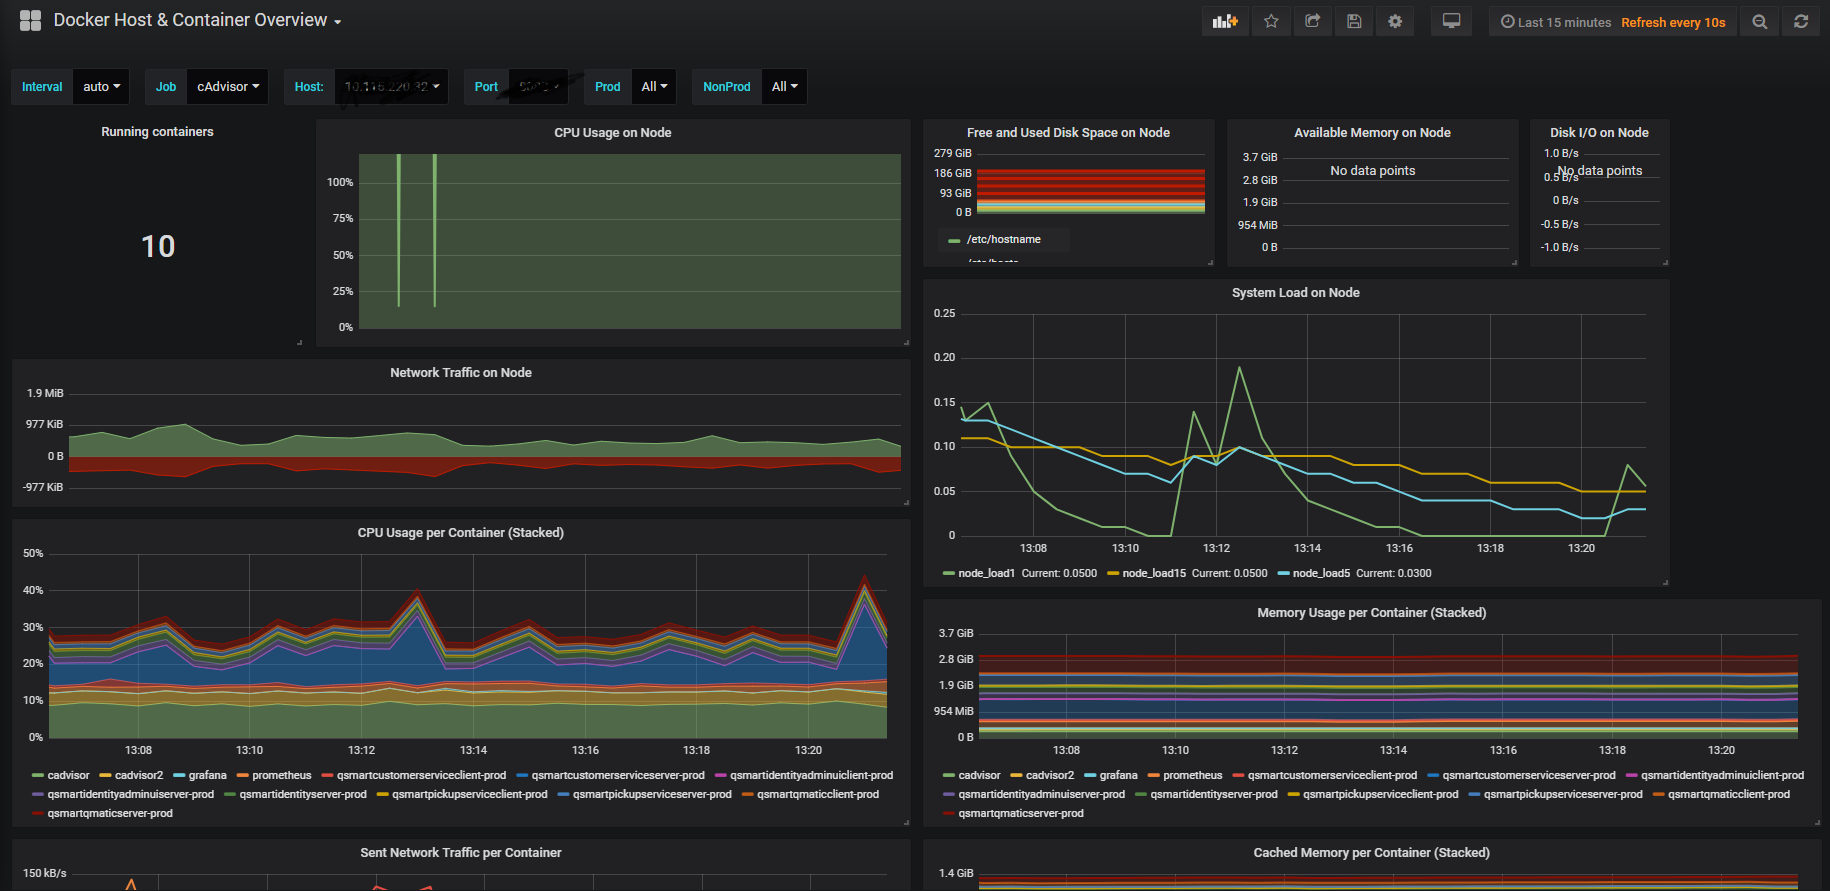
This dashboard monitors Docker container activity and host resource utilization, combining container-level metrics with node-wide metrics to give a unified view of performance and health. It highlights CPU usage (container_cpu_system_seconds_total, process_cpu_seconds_total) and memory/disk metrics (container_memory_usage_bytes, node_memory_MemFree, node_filesystem_size_bytes, node_filesystem_avail_bytes) across both per-container and aggregated node perspectives, including stacked views for per-container CPU, memory, and network usage to easily distinguish individual container impact from total host load.
Screenshots
Used Metrics 2424
-
cadvisor_version_info
-
container_cpu_system_seconds_total
-
container_cpu_usage_seconds_total
-
container_last_seen
-
container_memory_cache
-
container_memory_rss
-
container_memory_usage_bytes
-
container_network_receive_bytes_total
-
container_network_transmit_bytes_total
interval
node_disk_bytes_read
node_disk_bytes_written
-
node_exporter_build_info
-
node_filesystem_avail_bytes
-
node_filesystem_size_bytes
node_memory_Active
node_memory_Buffers
node_memory_Inactive
node_memory_KernelStack
node_memory_MemAvailable
node_memory_MemFree
node_memory_MemTotal
-
process_cpu_seconds_total
-
prometheus_build_info