Docker and system monitoring 80,14580,145 3.6 (7 reviews)
11/20/2016
2/6/2021
5
DockerHost Metrics
>=4.0.0-beta2
Prometheus
Description
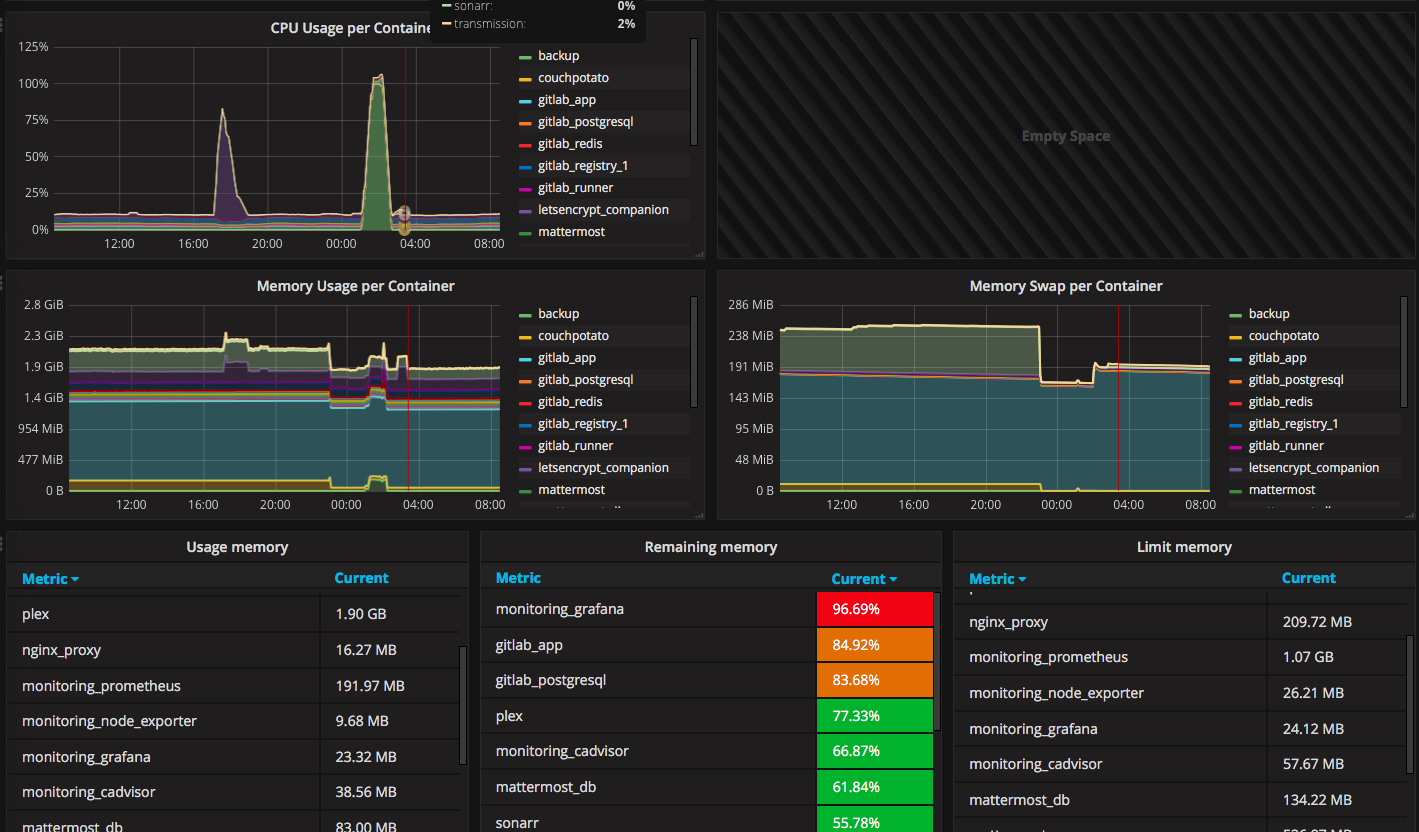
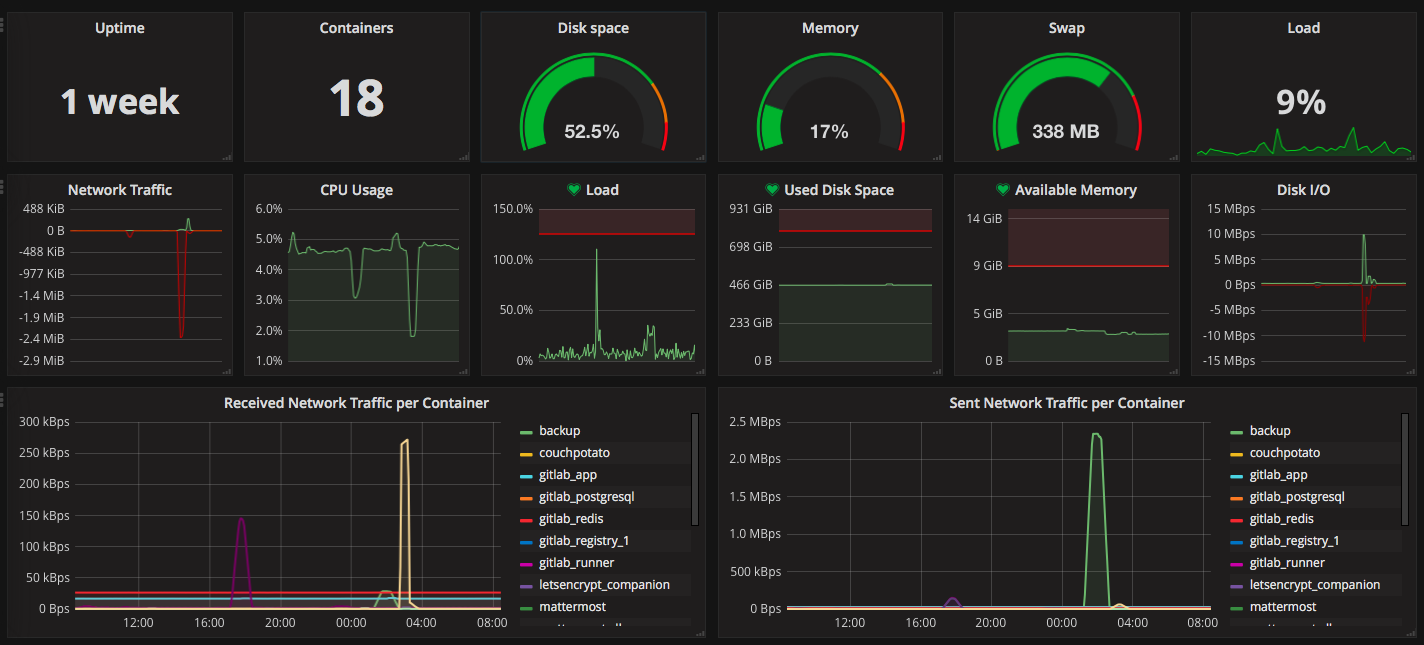
Monitors containerized and host system health by aggregating metrics from Docker and the OS to provide a unified view of resource usage and process activity. Key features include real-time resource utilization across containers and the host, per-container CPU, memory, and I/O metrics, and alert-ready patterns for saturation or failures. Notable metrics include container_cpu_usage_seconds_total, container_memory_usage_bytes, and node_system_memory_bytes to highlight per-container performance, total memory footprint, and host memory pressure.
Screenshots
Get Dashboard✕
Download
Copy to Clipboard