Django 4,5674,567
12/20/2022
12/22/2022
2
Web Servers
>=9.3.1
Prometheus
Description
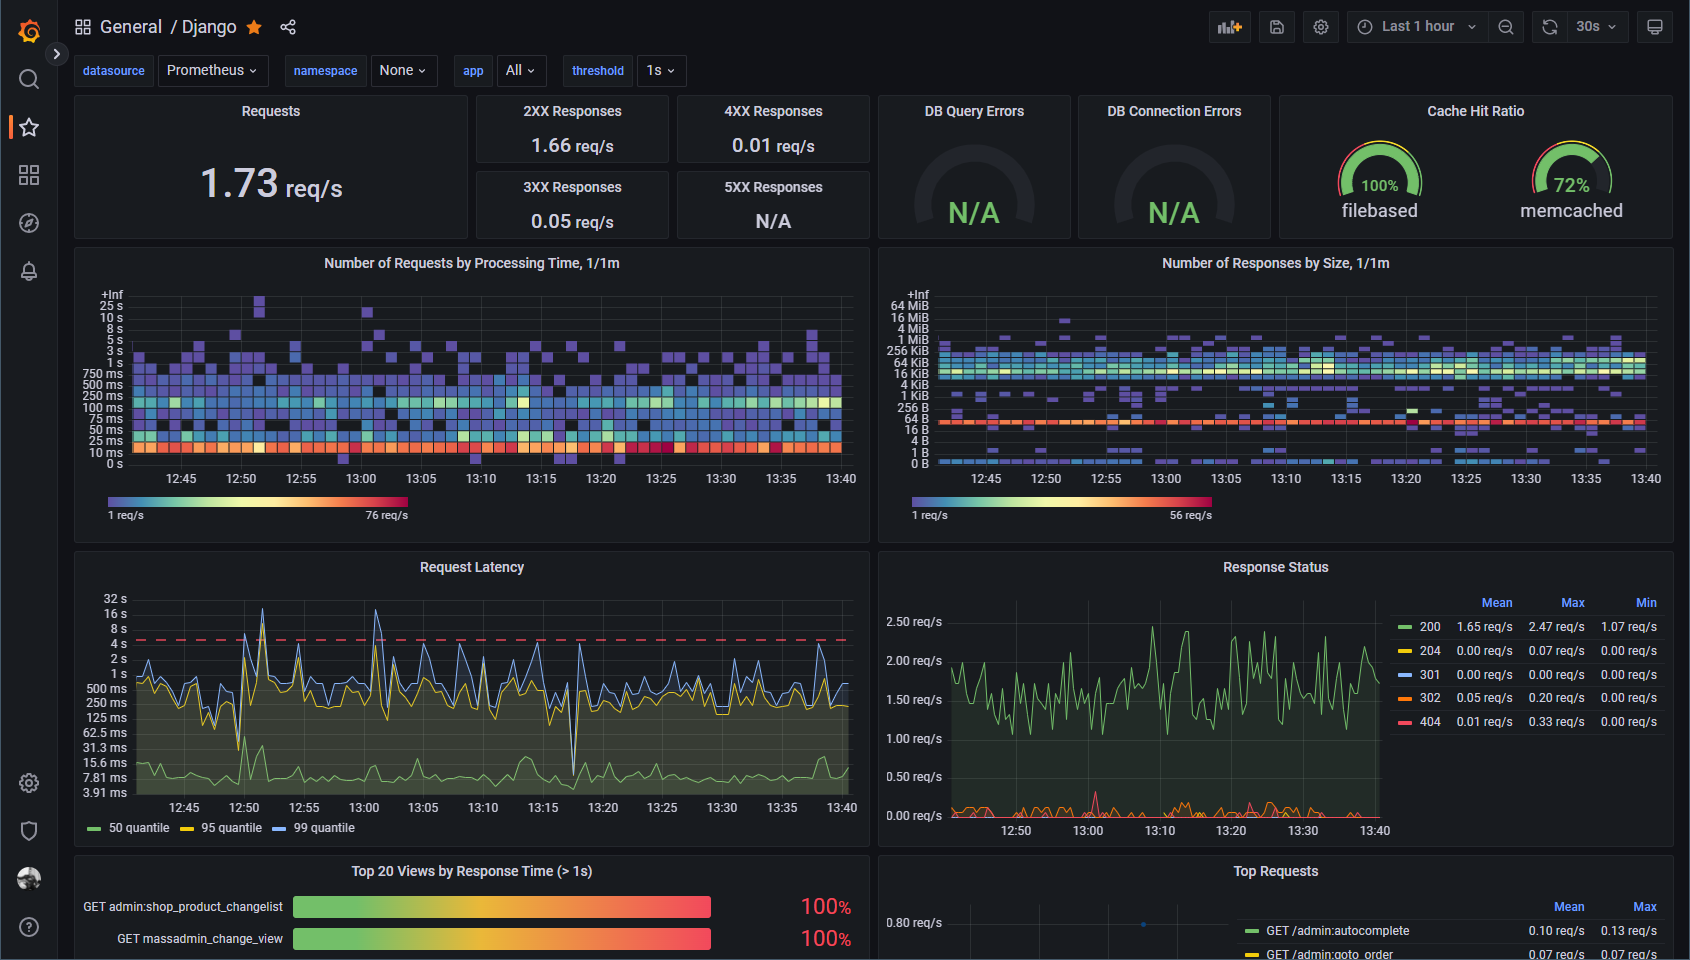
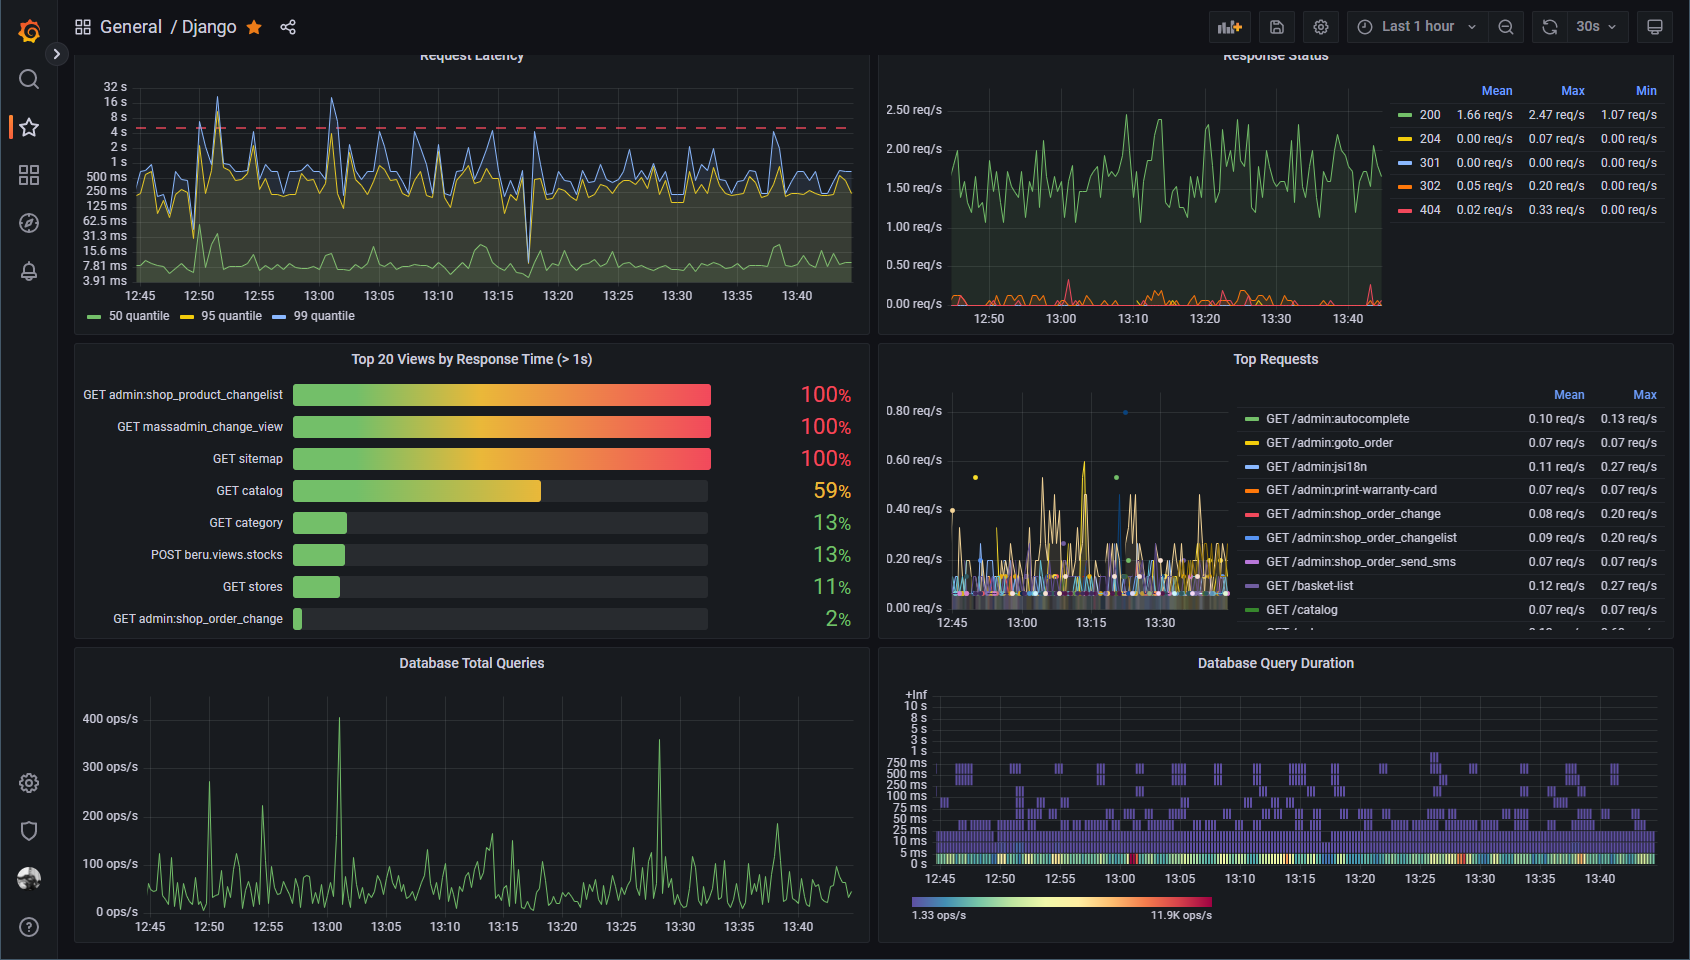
Django metrics dashboard using django-prometheus metrics exporter
Screenshots
Used Metrics 1515
django_cache_get_hits_total
django_cache_get_total
django_db_errors_total
django_db_execute_total
django_db_new_connection_errors_total
django_db_query_duration_seconds_bucket
django_http_requests_latency_including_middlewares_seconds_bucket
django_http_requests_latency_seconds_by_view_method_bucket
django_http_requests_latency_seconds_by_view_method_count
django_http_requests_total_by_transport_total
django_http_requests_total_by_view_transport_method_total
django_http_responses_body_total_bytes_bucket
django_http_responses_total_by_status_total
present_over_time
topk
Get Dashboard✕
Download
Copy to Clipboard