Database Status Dashboard 1,0091,009
3/31/2023
6/27/2023
2
>=9.4.7
Prometheus
Description
Screenshots
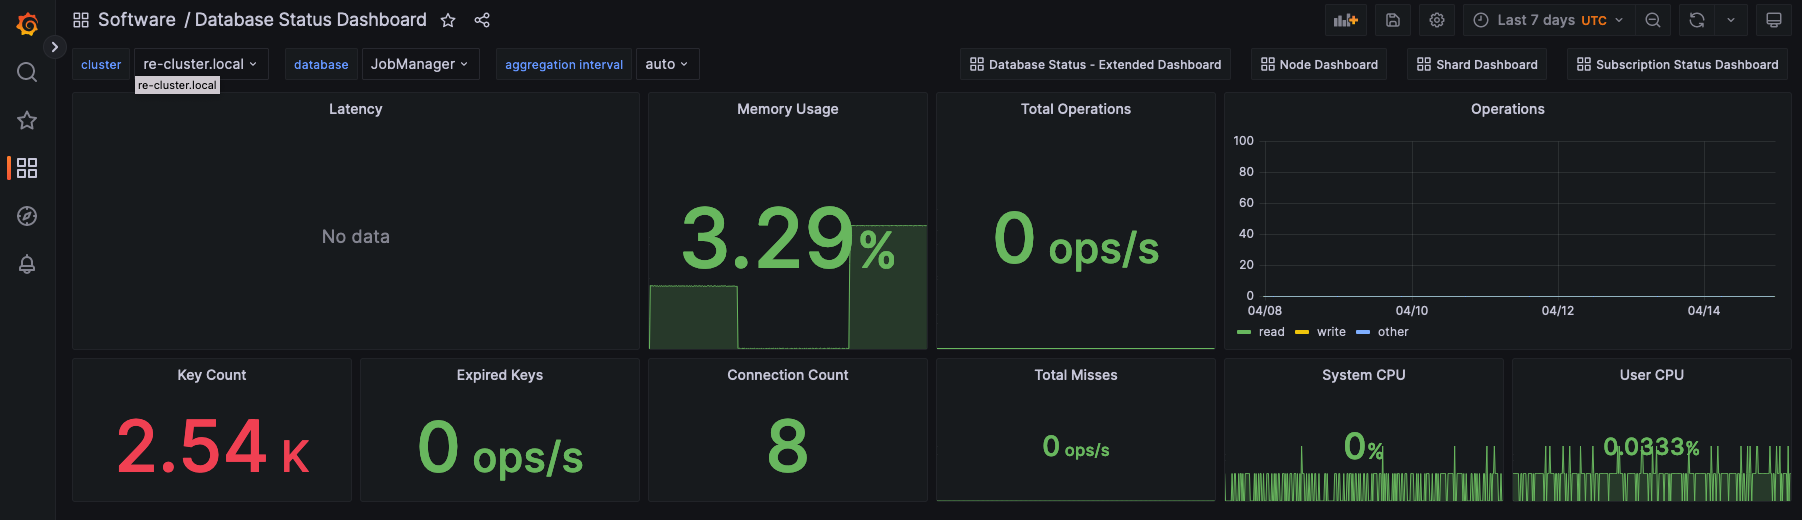
Used Metrics 1515
bdb_avg_read_latency
bdb_avg_write_latency
bdb_conns
bdb_expired_objects
bdb_main_thread_cpu_system
bdb_main_thread_cpu_user
bdb_memory_limit
bdb_no_of_keys
bdb_other_req
bdb_read_misses
bdb_read_req
bdb_total_req
bdb_used_memory
bdb_write_misses
bdb_write_req
Get Dashboard✕
Download
Copy to Clipboard