Dashbord for IIS Perfmon Metrics 4,3144,314 4.0 (4 reviews)
6/18/2020
6/18/2020
1
>=7.0.3
Prometheus
Description
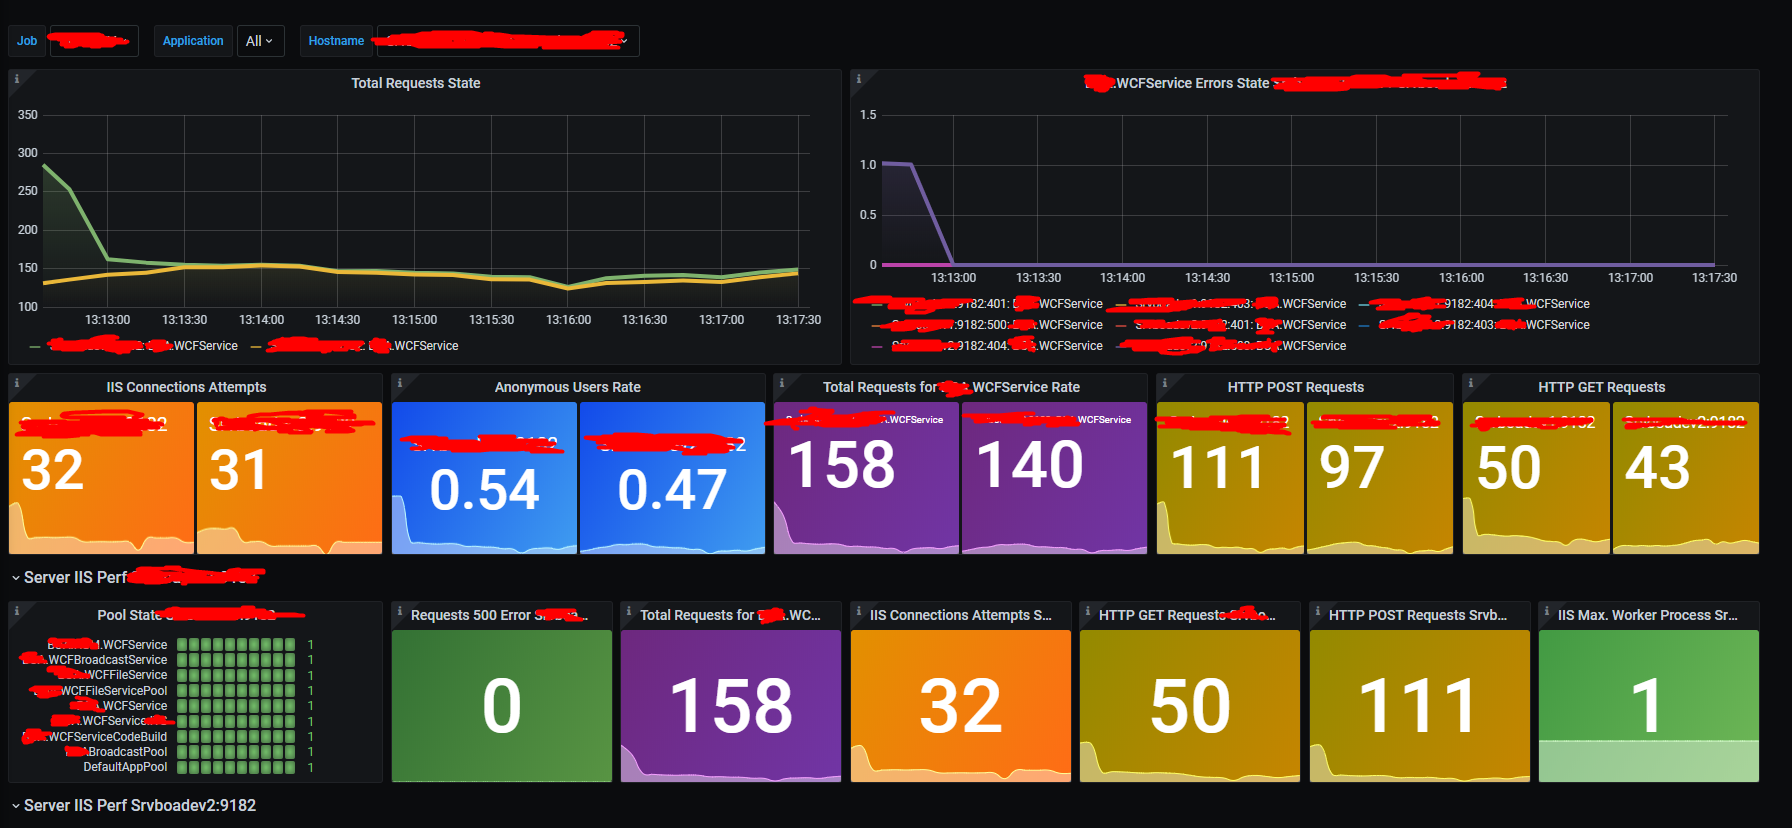
Basic overview of windows host metrics, based on WMI Exporter (v0.13.0)
Screenshots
Used Metrics 77
windows_iis_anonymous_users_total
windows_iis_connection_attempts_all_instances_total
windows_iis_current_application_pool_state
windows_iis_maximum_worker_processes
windows_iis_requests_total
windows_iis_worker_request_errors_total
windows_iis_worker_requests_total
Get Dashboard✕
Download
Copy to Clipboard