Dashboard for smartctl_exporter 56,37956,379
Description
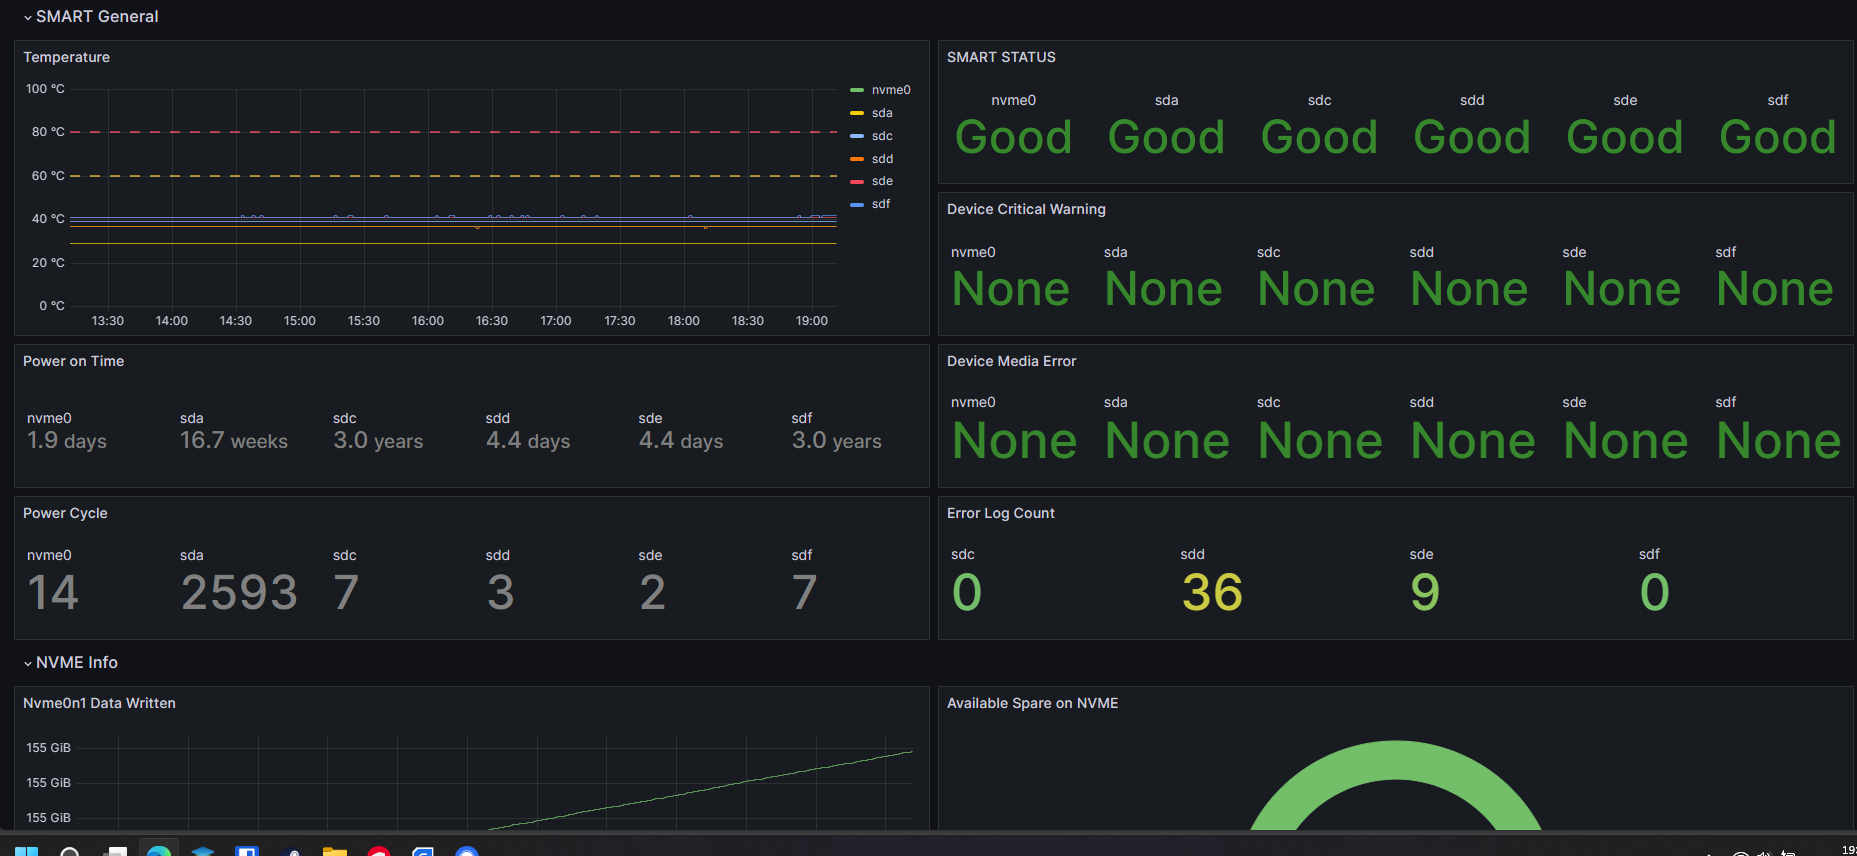
This dashboard monitors SMART data from drives, presenting health and reliability indicators through key panels such as smartctl_device_smart_status and smartctl_device_critical_warning. It highlights critical risk factors like smartctl_device_temperature, smartctl_device_media_errors, and smartctl_device_error_log_count, while also tracking lifecycle metrics such as smartctl_device_power_on_seconds, smartctl_device_power_cycle_count, and smartctl_device_bytes_written to provide a comprehensive view of drive condition and usage. Alerts and visual cues emphasize potential failures, and time-based trends enable proactive maintenance.
Screenshots
Used Metrics 99
smartctl_device_available_spare
smartctl_device_bytes_written
smartctl_device_critical_warning
smartctl_device_error_log_count
smartctl_device_media_errors
smartctl_device_power_cycle_count
smartctl_device_power_on_seconds
smartctl_device_smart_status
smartctl_device_temperature