CPU Utilization Details (Cores) 10,96010,960 3.7 (3 reviews)
12/25/2017
1/18/2019
1
Host Metrics
>=4.6.1
Prometheus
Description
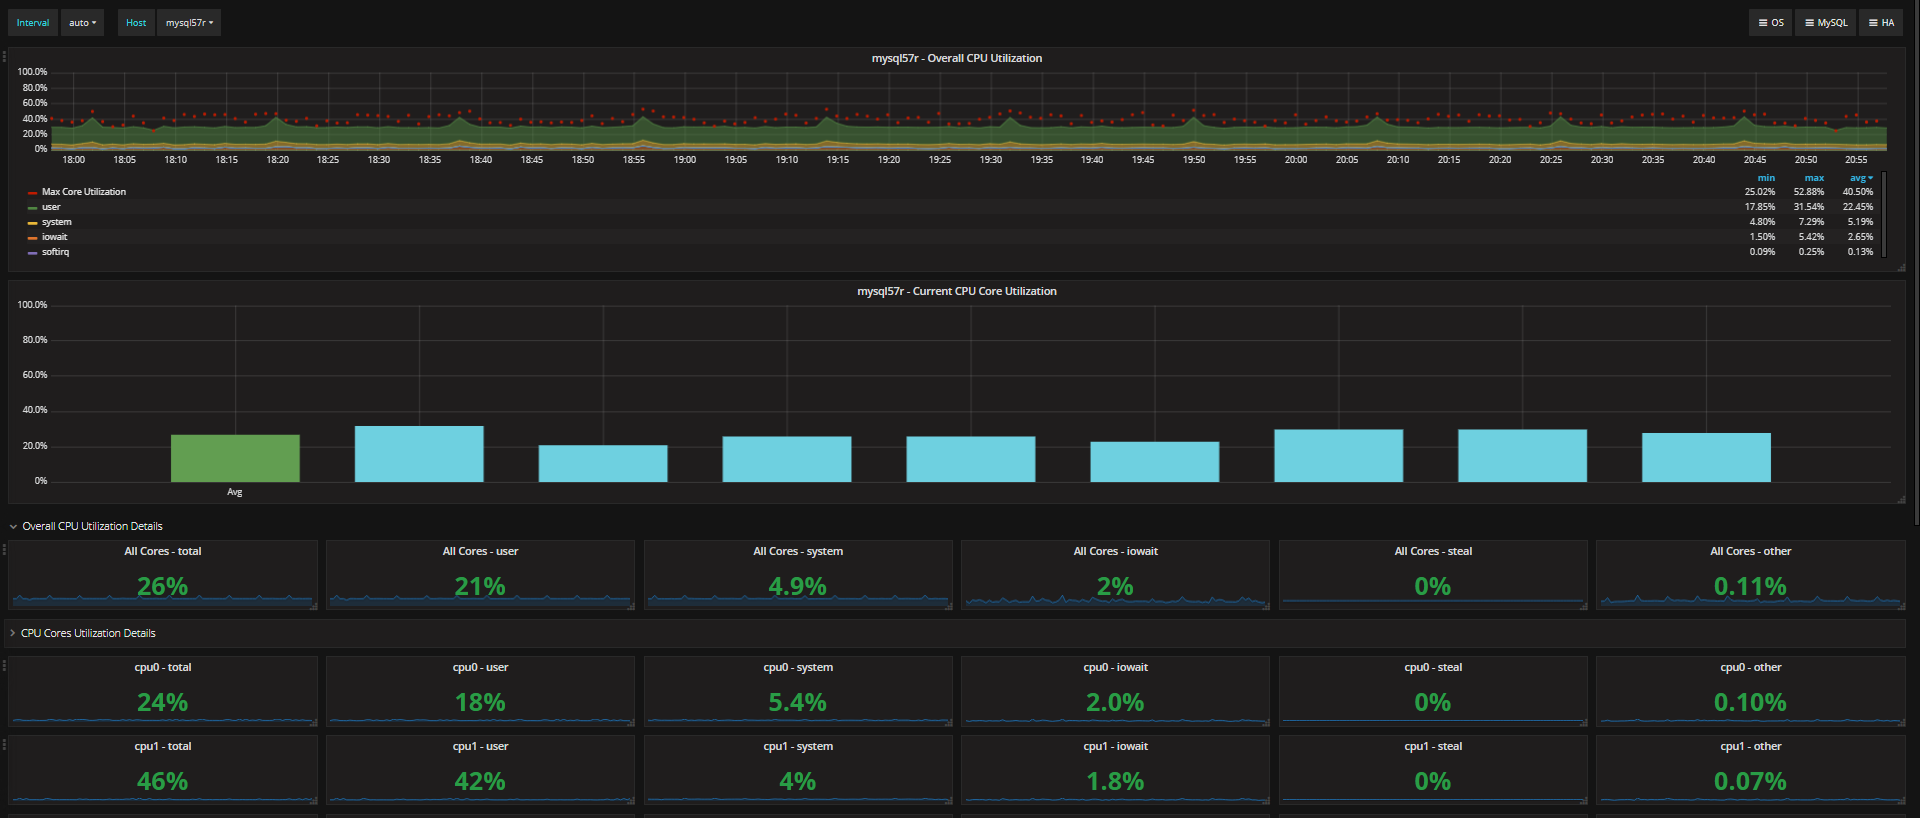
This is experimental dashboard for Percona Monitoring and Management (PMM) which provides CPU utilization details for multi-core systems. It allows to easily see if overall CPU usage is high or if there are overloaded cores.
Screenshots
Get Dashboard✕
Download
Copy to Clipboard