CoreDNS with NodeLocalDNS 110,945110,945
Description
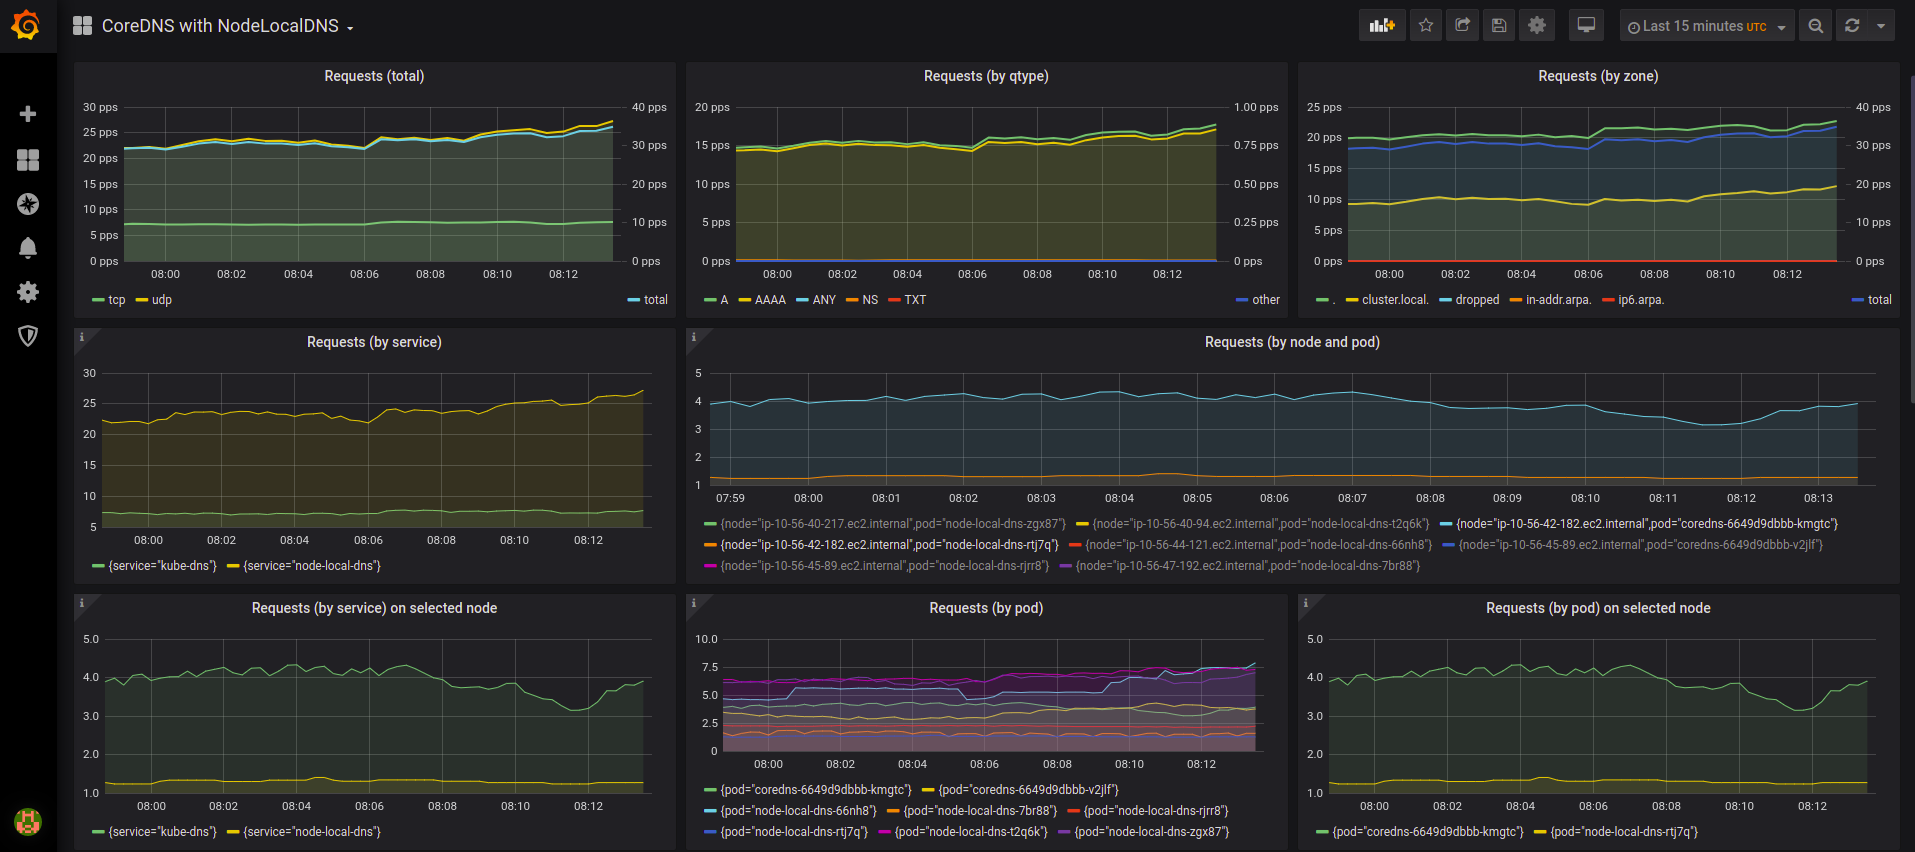
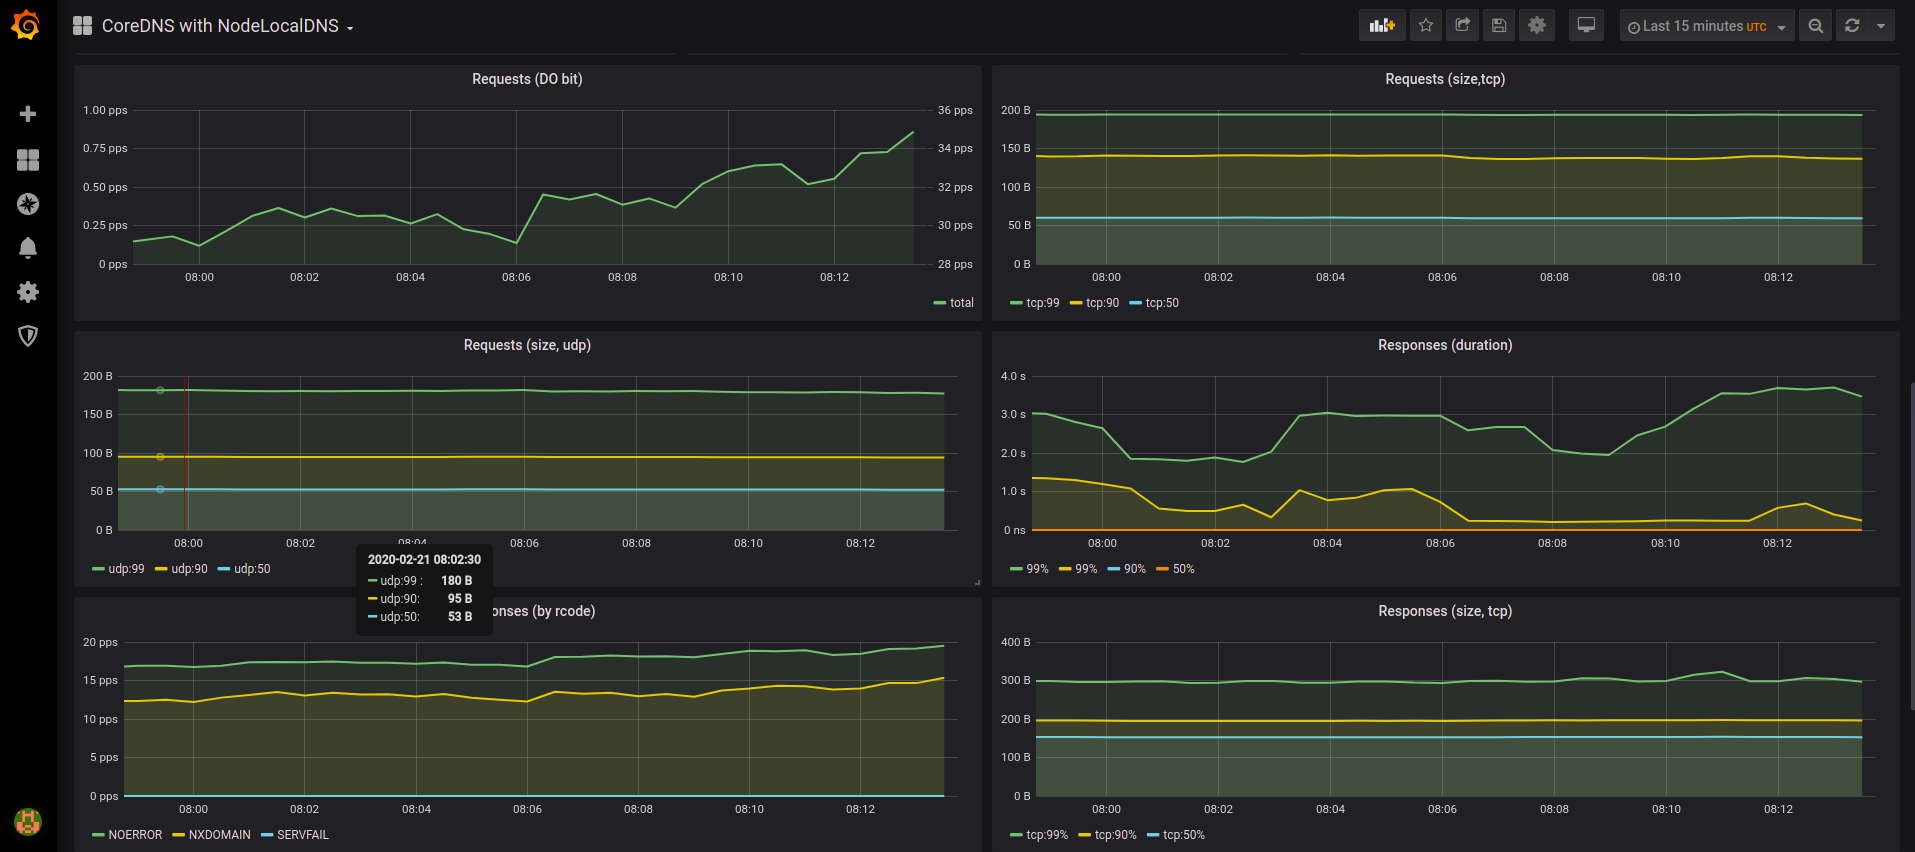
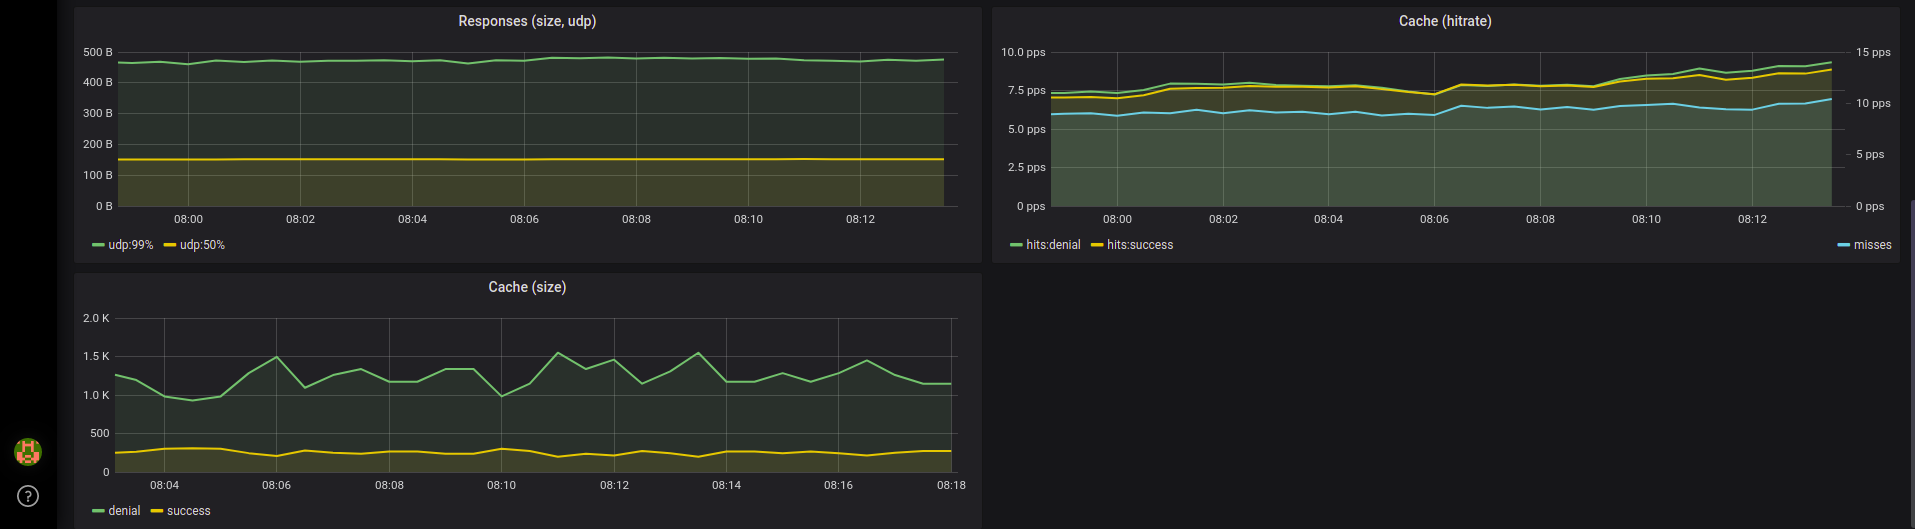
This dashboard provides end-to-end visibility into CoreDNS with NodeLocal DNS, aggregating DNS request traffic, responses, and caching metrics across zones, services, nodes, and pods. It emphasizes latency and size characteristics through bucketed latency distributions and response size/, with focused views like coredns_dns_request_duration_seconds_bucket, coredns_dns_response_size_bytes_bucket, and coredns_cache_hits_total to surface performance and cache effectiveness across multiple dimensions (zone, qtype, service, and node).
Screenshots
Used Metrics 99
coredns_cache_entries
coredns_cache_hits_total
coredns_cache_misses_total
coredns_dns_do_requests_total
coredns_dns_request_duration_seconds_bucket
coredns_dns_request_size_bytes_bucket
coredns_dns_requests_total
coredns_dns_response_size_bytes_bucket
coredns_dns_responses_total