CoreDNS (Cluster and Node-Local) 33,56833,568
6/12/2021
6/12/2021
1
>=7.4.3
Prometheus
Description
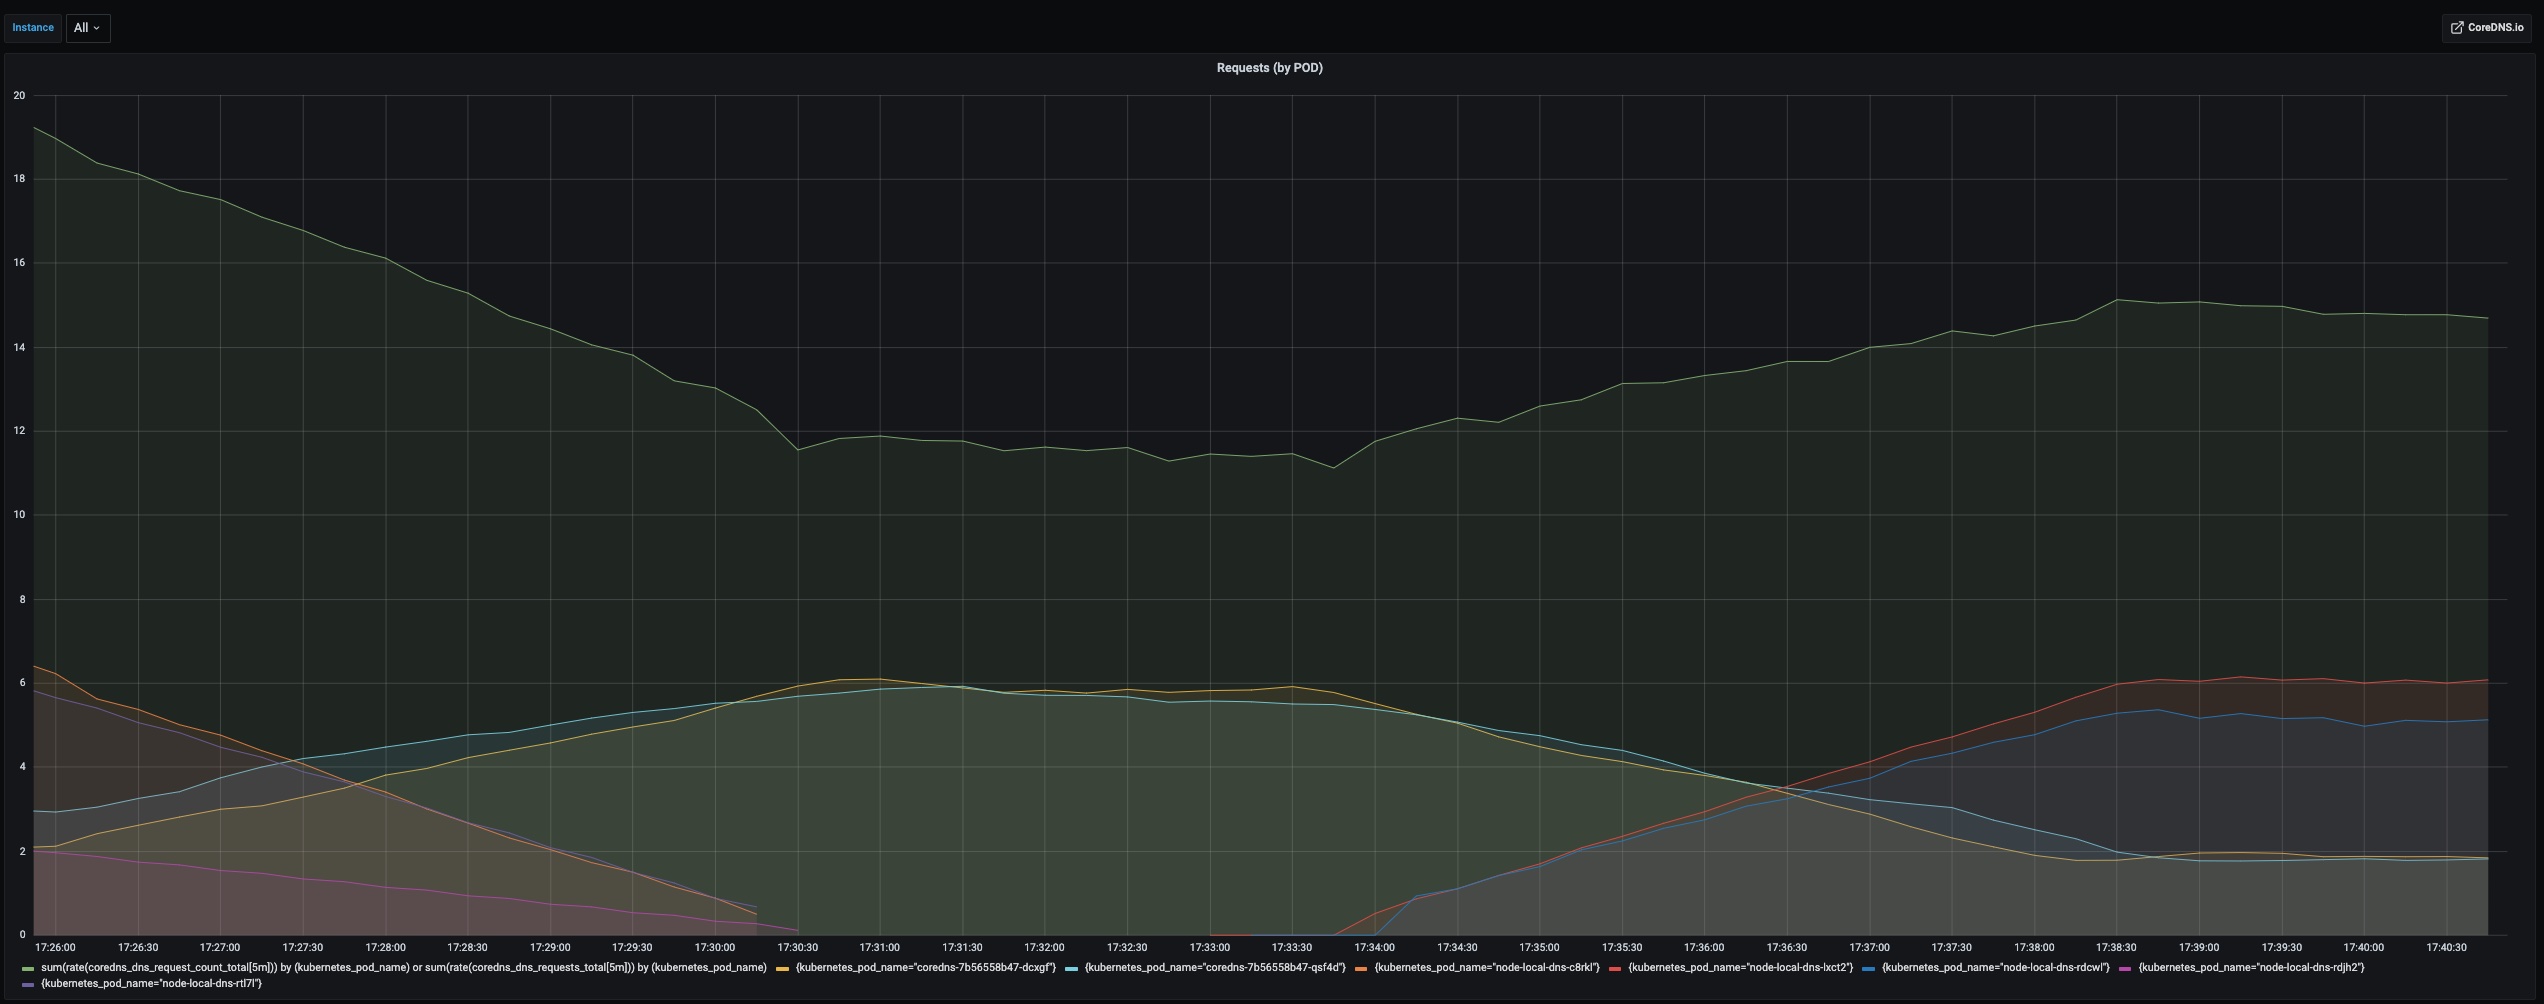
A dashboard for the CoreDNS DNS server metrics 1.7.0+ and with a panel of total requests by POD to compare before/after impact on a cluster's kube-dns PODs after deploying node-local-dns. Based on the CoreDNS dashboards by ejkinger and buhay.
Screenshots
Used Metrics 1414
coredns_cache_entries
coredns_cache_hits_total
coredns_cache_misses_total
coredns_cache_size
coredns_dns_do_requests_total
coredns_dns_request_count_total
coredns_dns_request_do_count_total
coredns_dns_request_duration_seconds_bucket
coredns_dns_request_size_bytes_bucket
coredns_dns_request_type_count_total
coredns_dns_requests_total
coredns_dns_response_rcode_count_total
coredns_dns_response_size_bytes_bucket
coredns_dns_responses_total
Get Dashboard✕
Download
Copy to Clipboard