CoreDNS 49,68249,682 5.0 (1 reviews)
Description
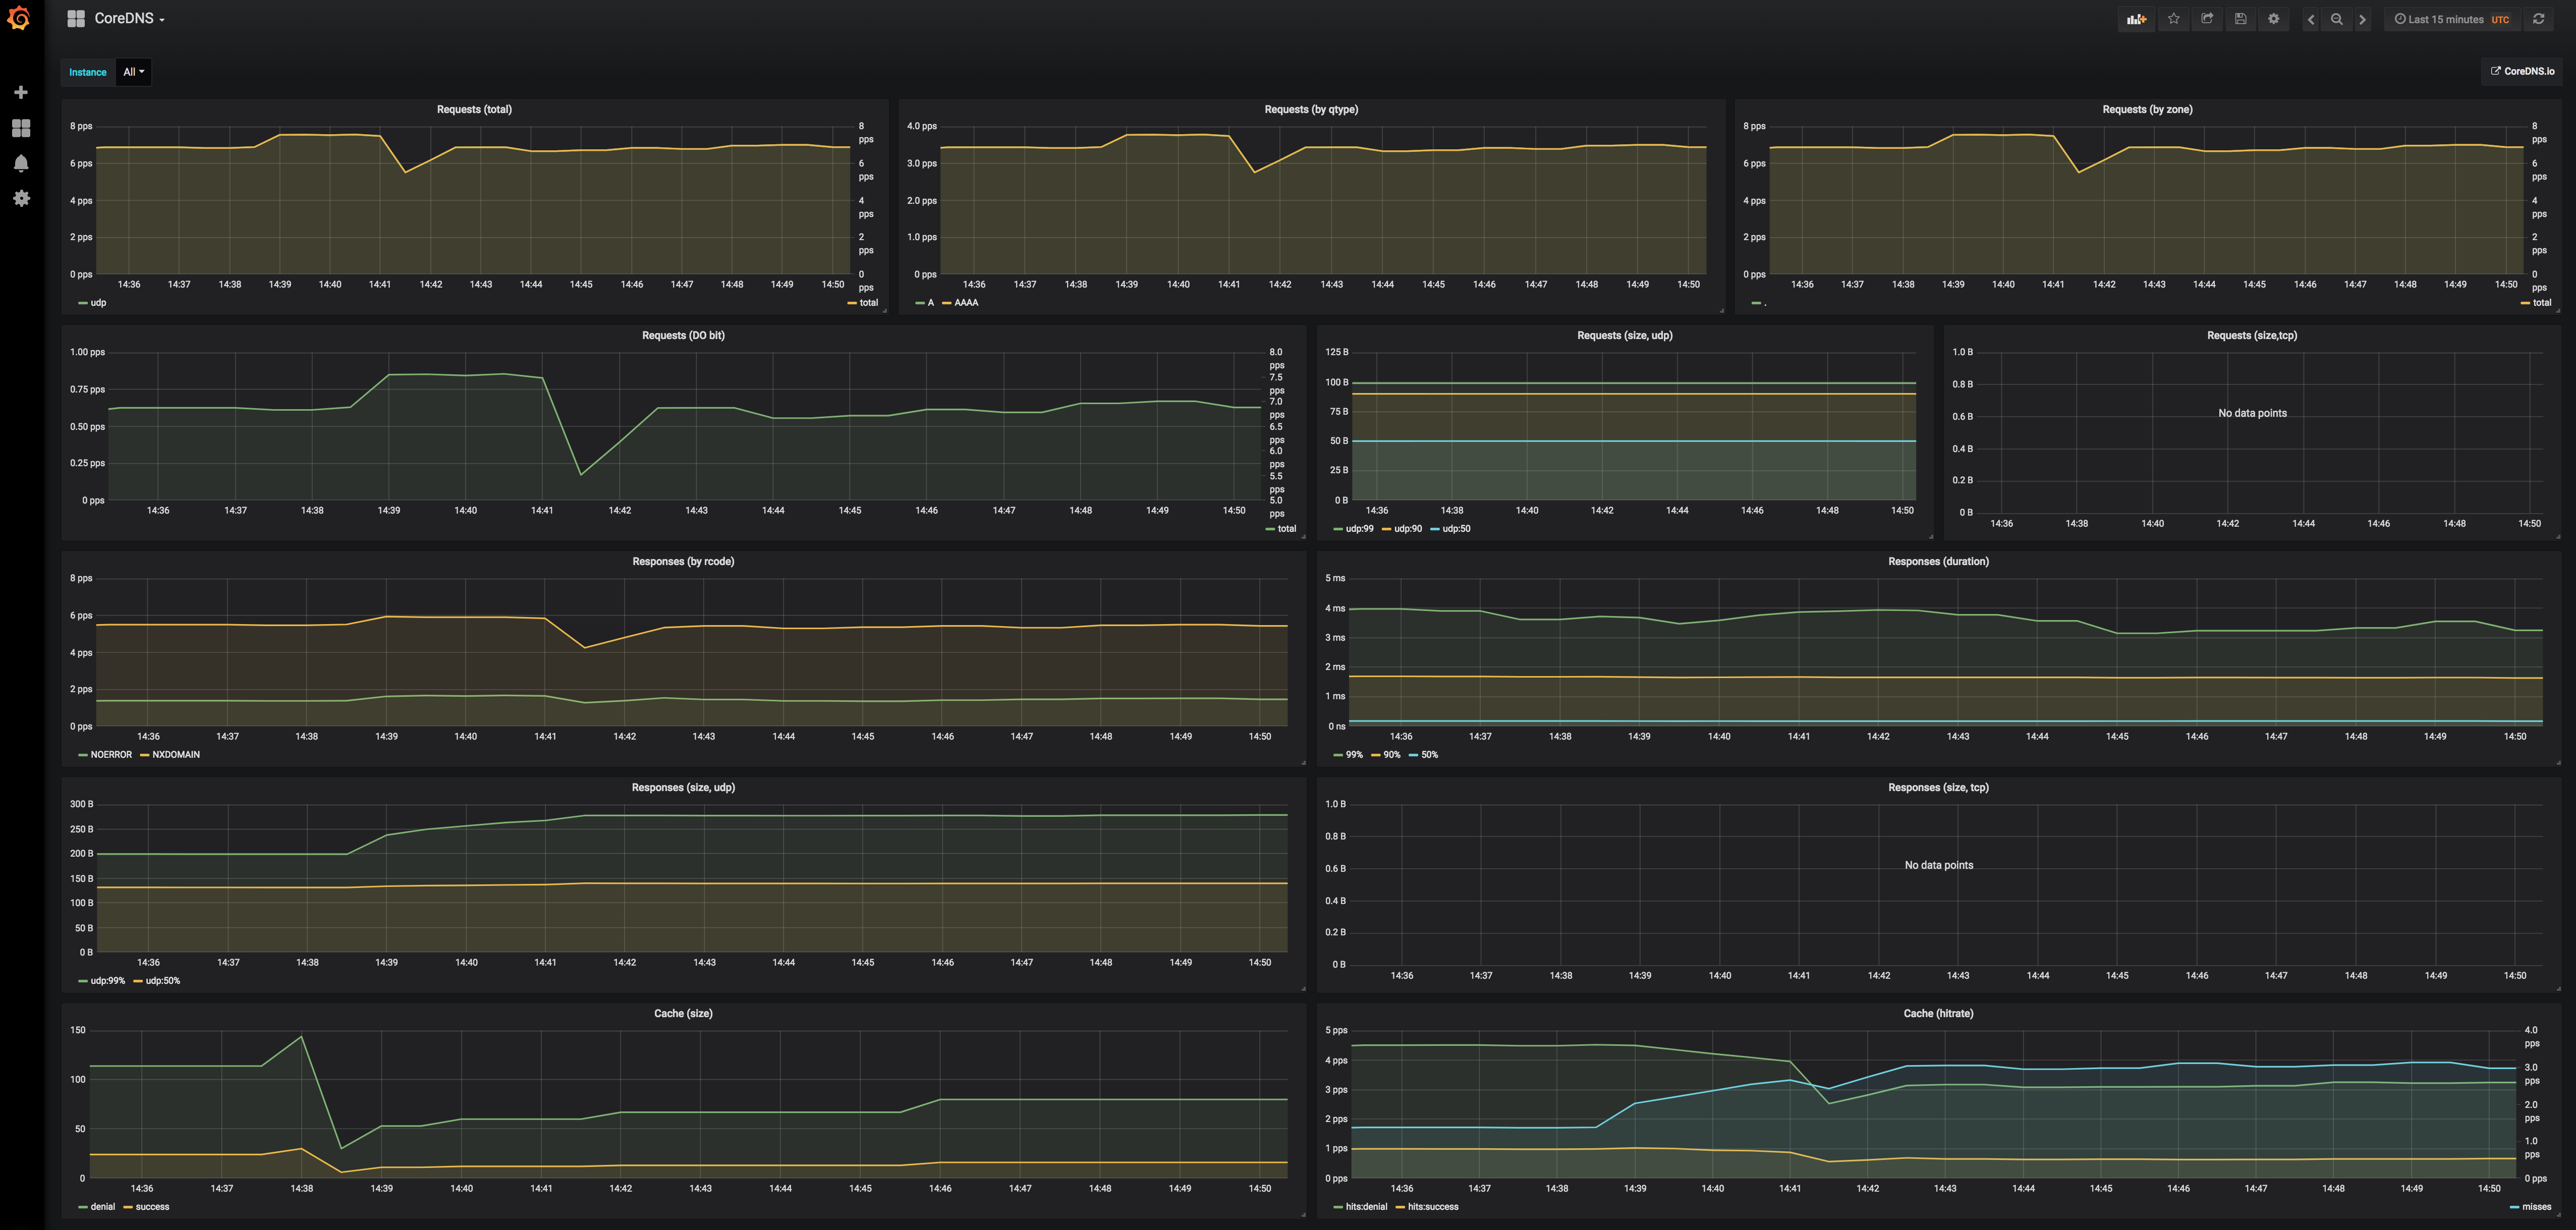
This dashboard monitors CoreDNS performance and its DNS traffic characteristics, focusing on request volumes, types, and outcomes. It highlights per-transaction details such as coredns_dns_request_count_total, coredns_dns_request_type_count_total, and coredns_dns_response_rcode_count_total to surface query distribution, error patterns, and response quality, while also tracking latency and cache efficiency with duration and cache related panels. Key features include breakdowns by query type and zone, request/response size distributions, and cache hit/miss metrics to diagnose throughput and caching behavior.
Screenshots
Used Metrics 1010
coredns_cache_hits_total
coredns_cache_misses_total
coredns_cache_size
coredns_dns_request_count_total
coredns_dns_request_do_count_total
coredns_dns_request_duration_seconds_bucket
coredns_dns_request_size_bytes_bucket
coredns_dns_request_type_count_total
coredns_dns_response_rcode_count_total
coredns_dns_response_size_bytes_bucket