CoreDNS 1.7.0+ 3,510,3003,510,300 5.0 (3 reviews)
Description
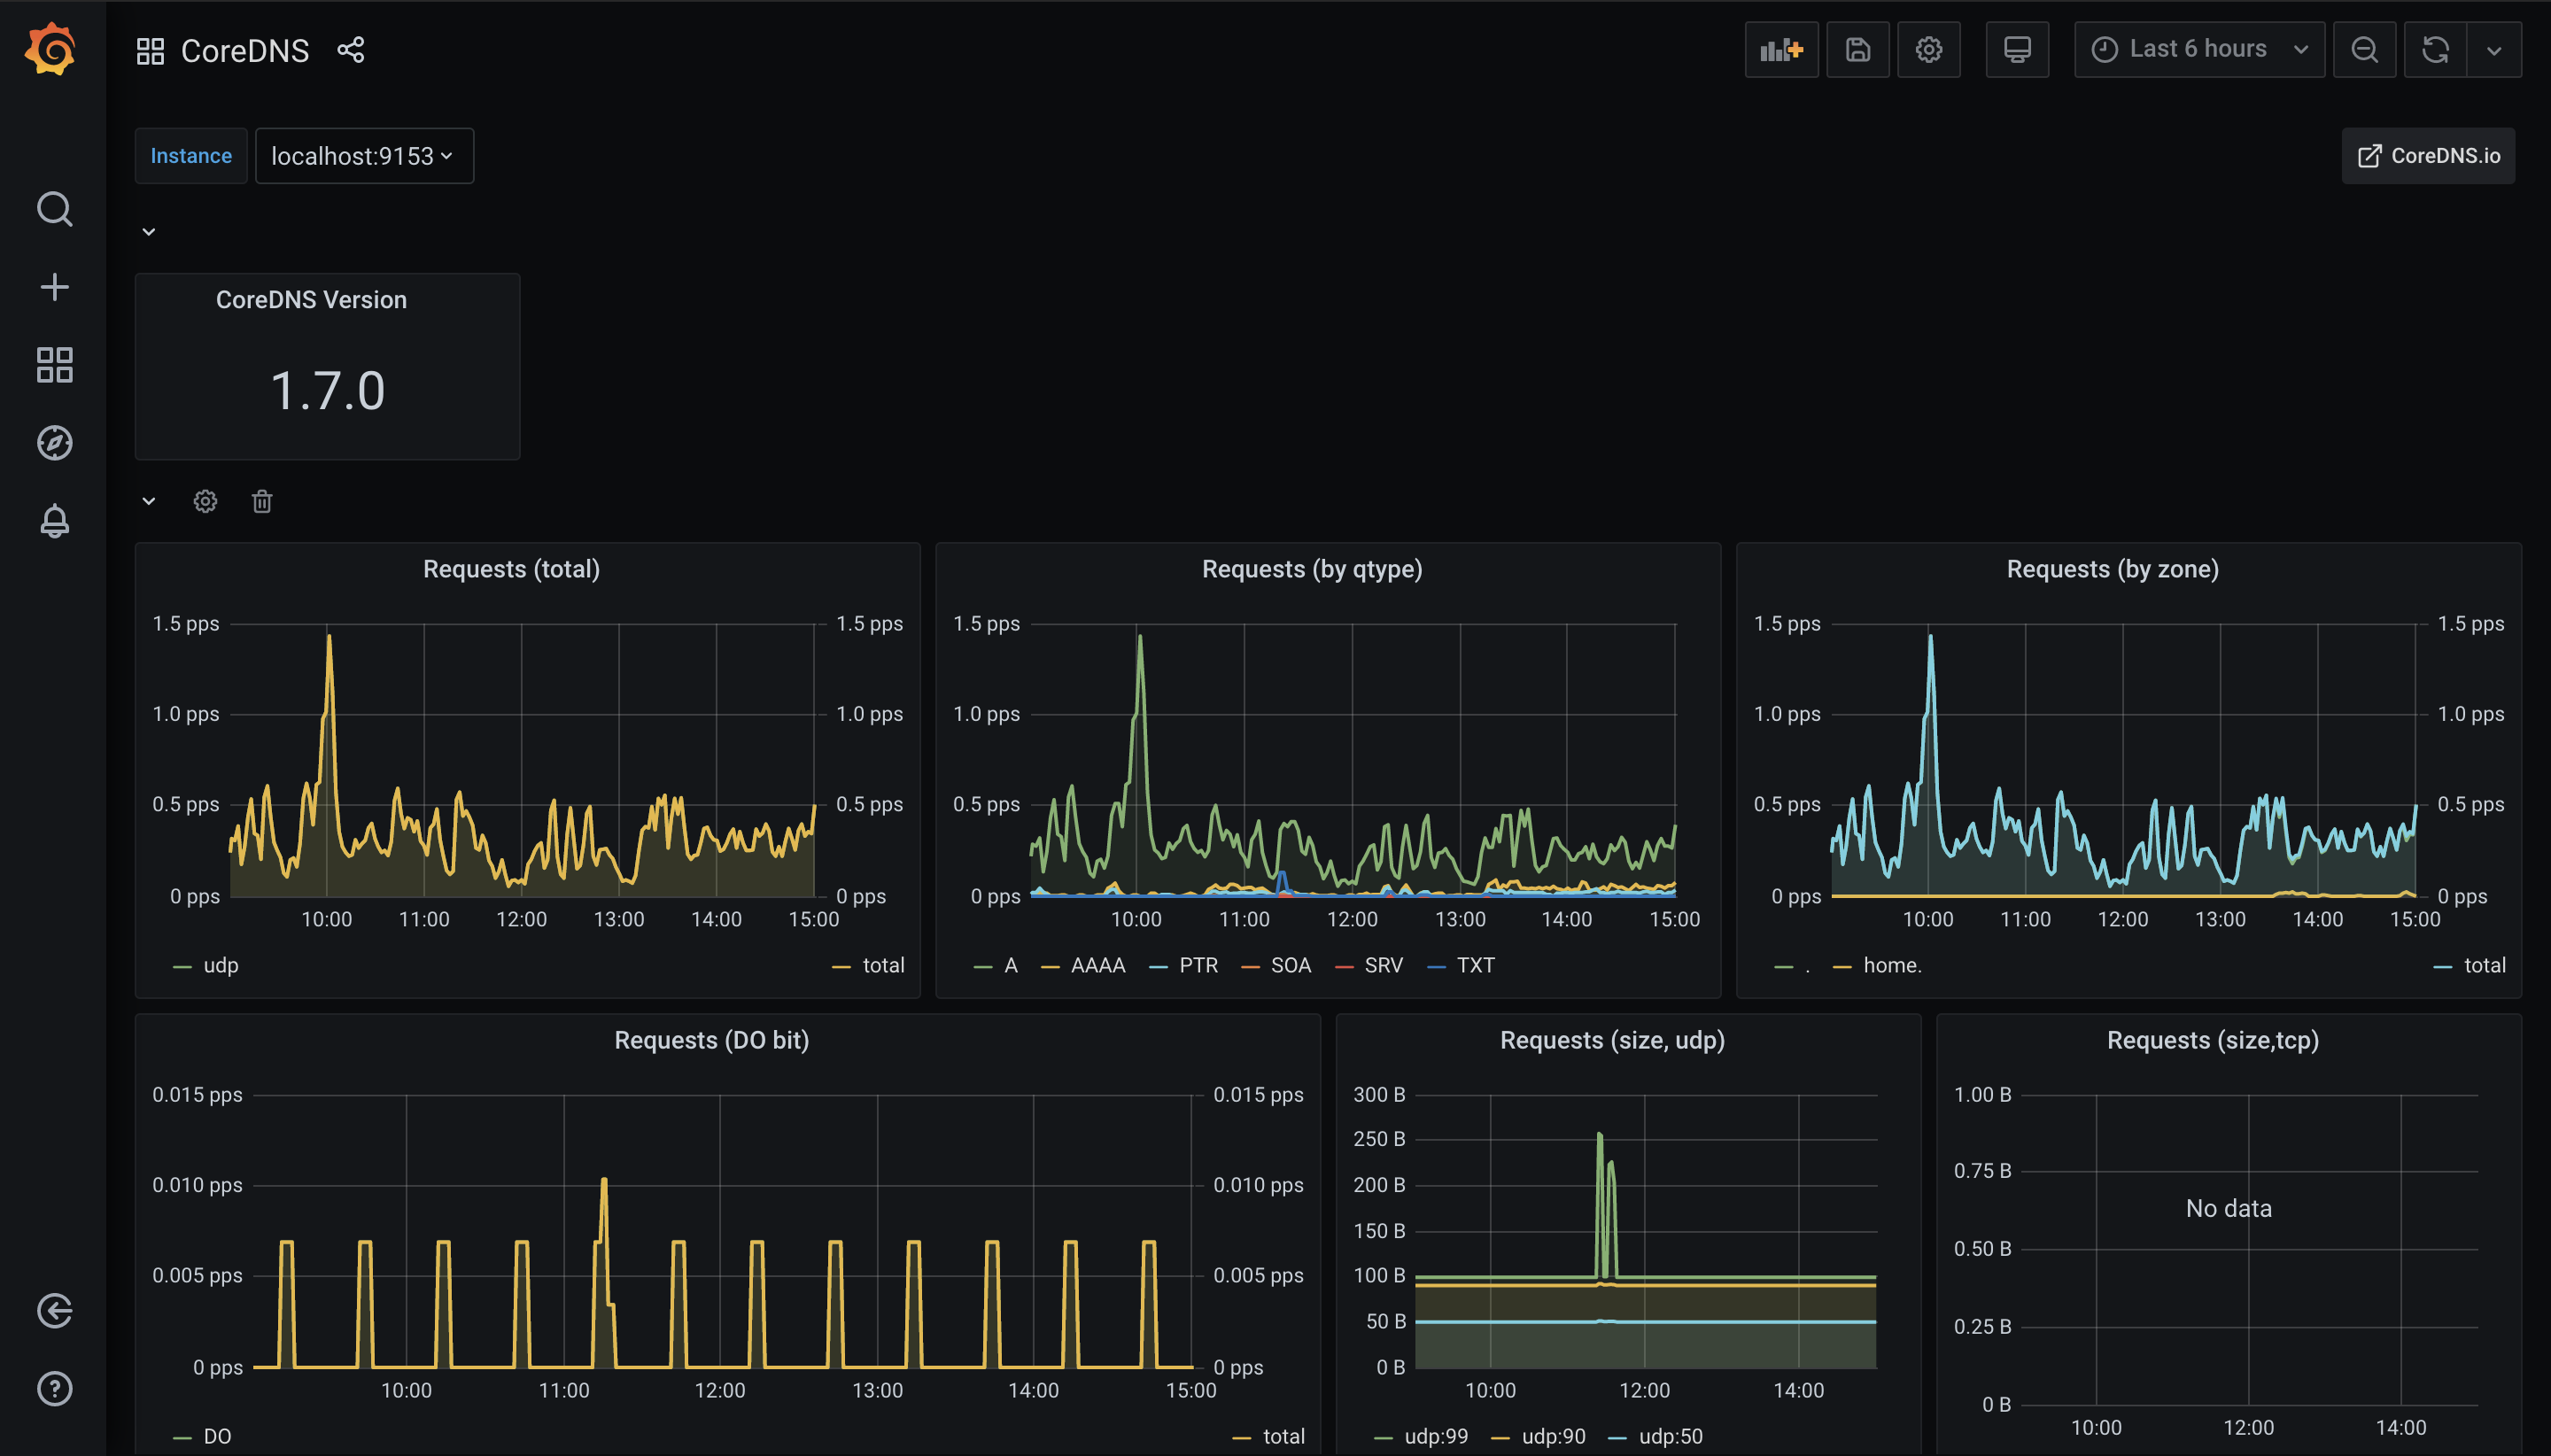
This dashboard monitors CoreDNS performance and health, aggregating build metadata, request volumes, and response characteristics to surface operational insights. It highlights request traffic and types with coredns_dns_request_count_total and coredns_dns_request_type_count_total, response behavior via coredns_dns_responses_total and coredns_dns_response_rcode_count_total, and caching efficiency through coredns_dns_request_size_bytes_bucket and coredns_dns_responses_total alongside cache-specific panels like Cache (size) and Cache (hitrate) for latency and hit rate assessment.
Screenshots
Used Metrics 1515
coredns_build_info
coredns_cache_entries
coredns_cache_hits_total
coredns_cache_misses_total
coredns_cache_size
coredns_dns_do_requests_total
coredns_dns_request_count_total
coredns_dns_request_do_count_total
coredns_dns_request_duration_seconds_bucket
coredns_dns_request_size_bytes_bucket
coredns_dns_request_type_count_total
coredns_dns_requests_total
coredns_dns_response_rcode_count_total
coredns_dns_response_size_bytes_bucket
coredns_dns_responses_total