CoreDNS 57,07657,076
4/5/2020
4/5/2020
1
>=6.6.2
Prometheus
Description
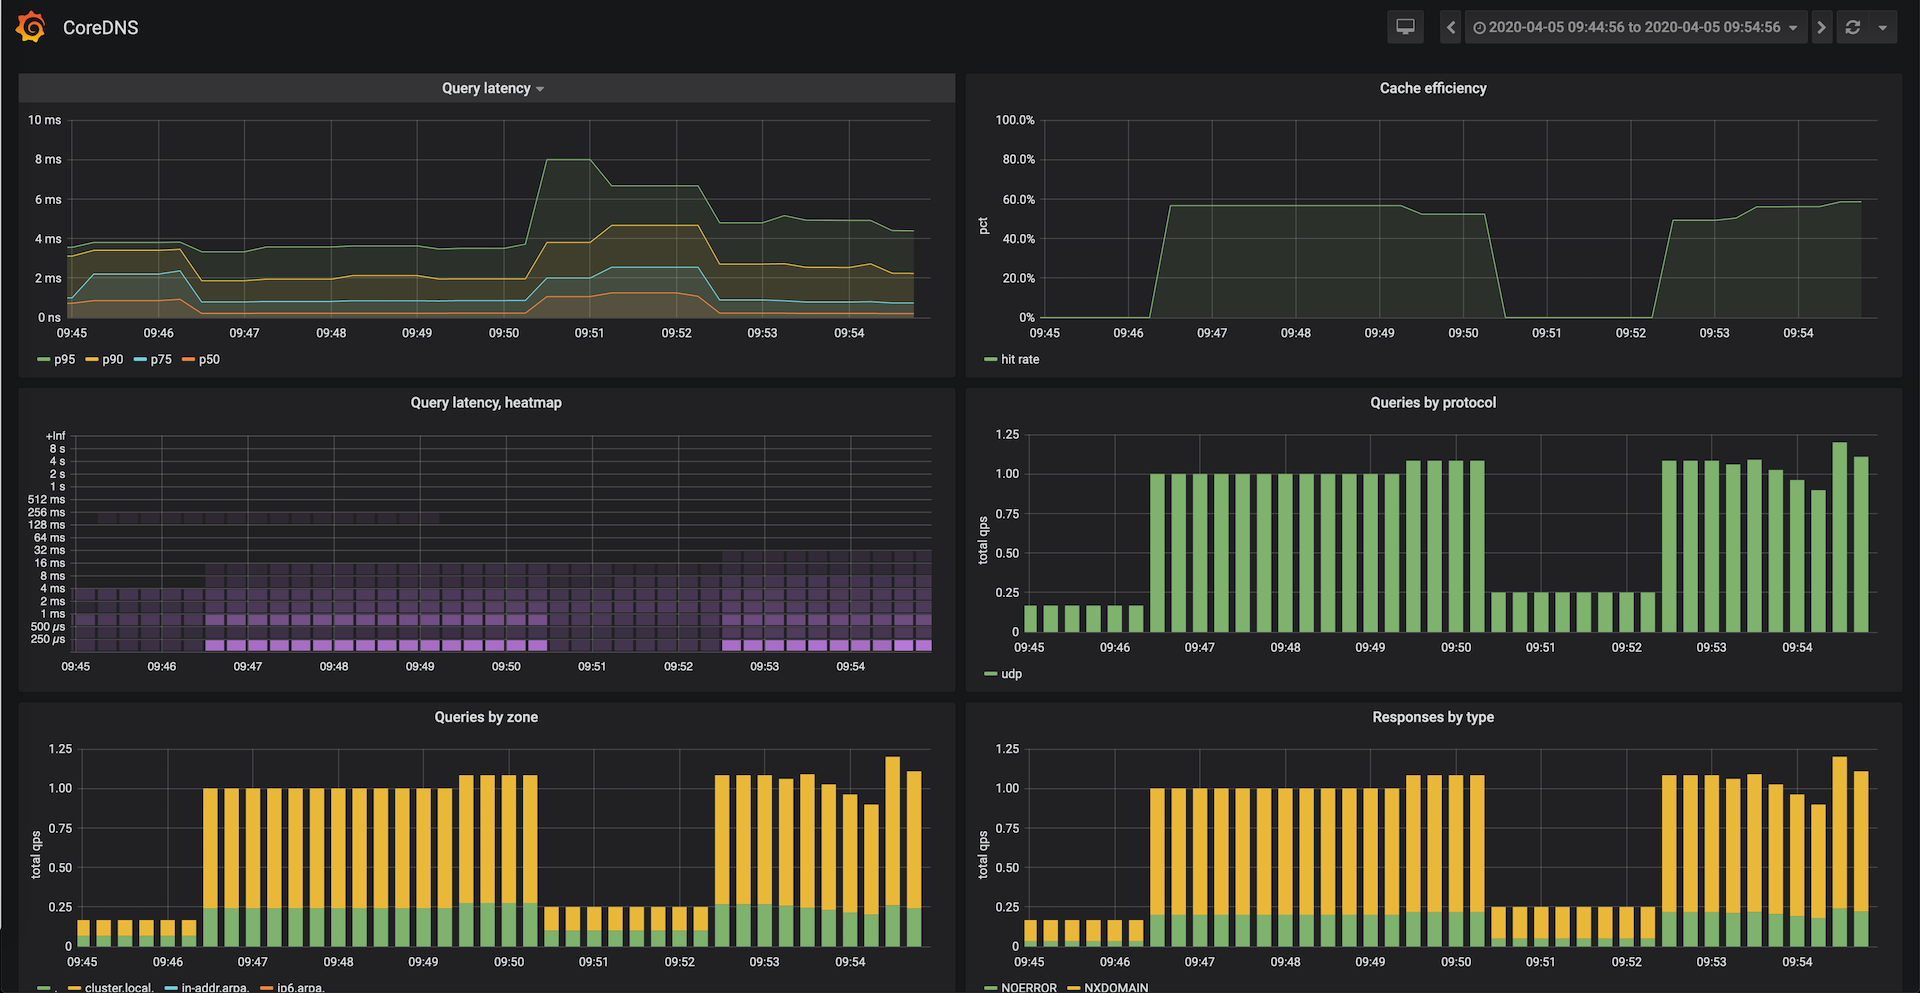
This dashboard monitors CoreDNS performance and behavior by tracking DNS latency, cache efficiency, and request/response distributions. It highlights latency distributions with a coredns_dns_request_duration_seconds_bucket heatmap, cache hit rate via coredns_cache_hits_total, and traffic composition through metrics like coredns_dns_request_count_total and coredns_dns_response_rcode_count_total to surface protocol, zone, and type breakdowns.
Screenshots
Used Metrics 55
coredns_cache_hits_total
coredns_dns_request_count_total
coredns_dns_request_duration_seconds_bucket
coredns_dns_request_type_count_total
coredns_dns_response_rcode_count_total
Get Dashboard✕
Download
Copy to Clipboard