Container resources 4,6384,638
7/4/2021
7/4/2021
1
>=8.0.3
Prometheus
Description
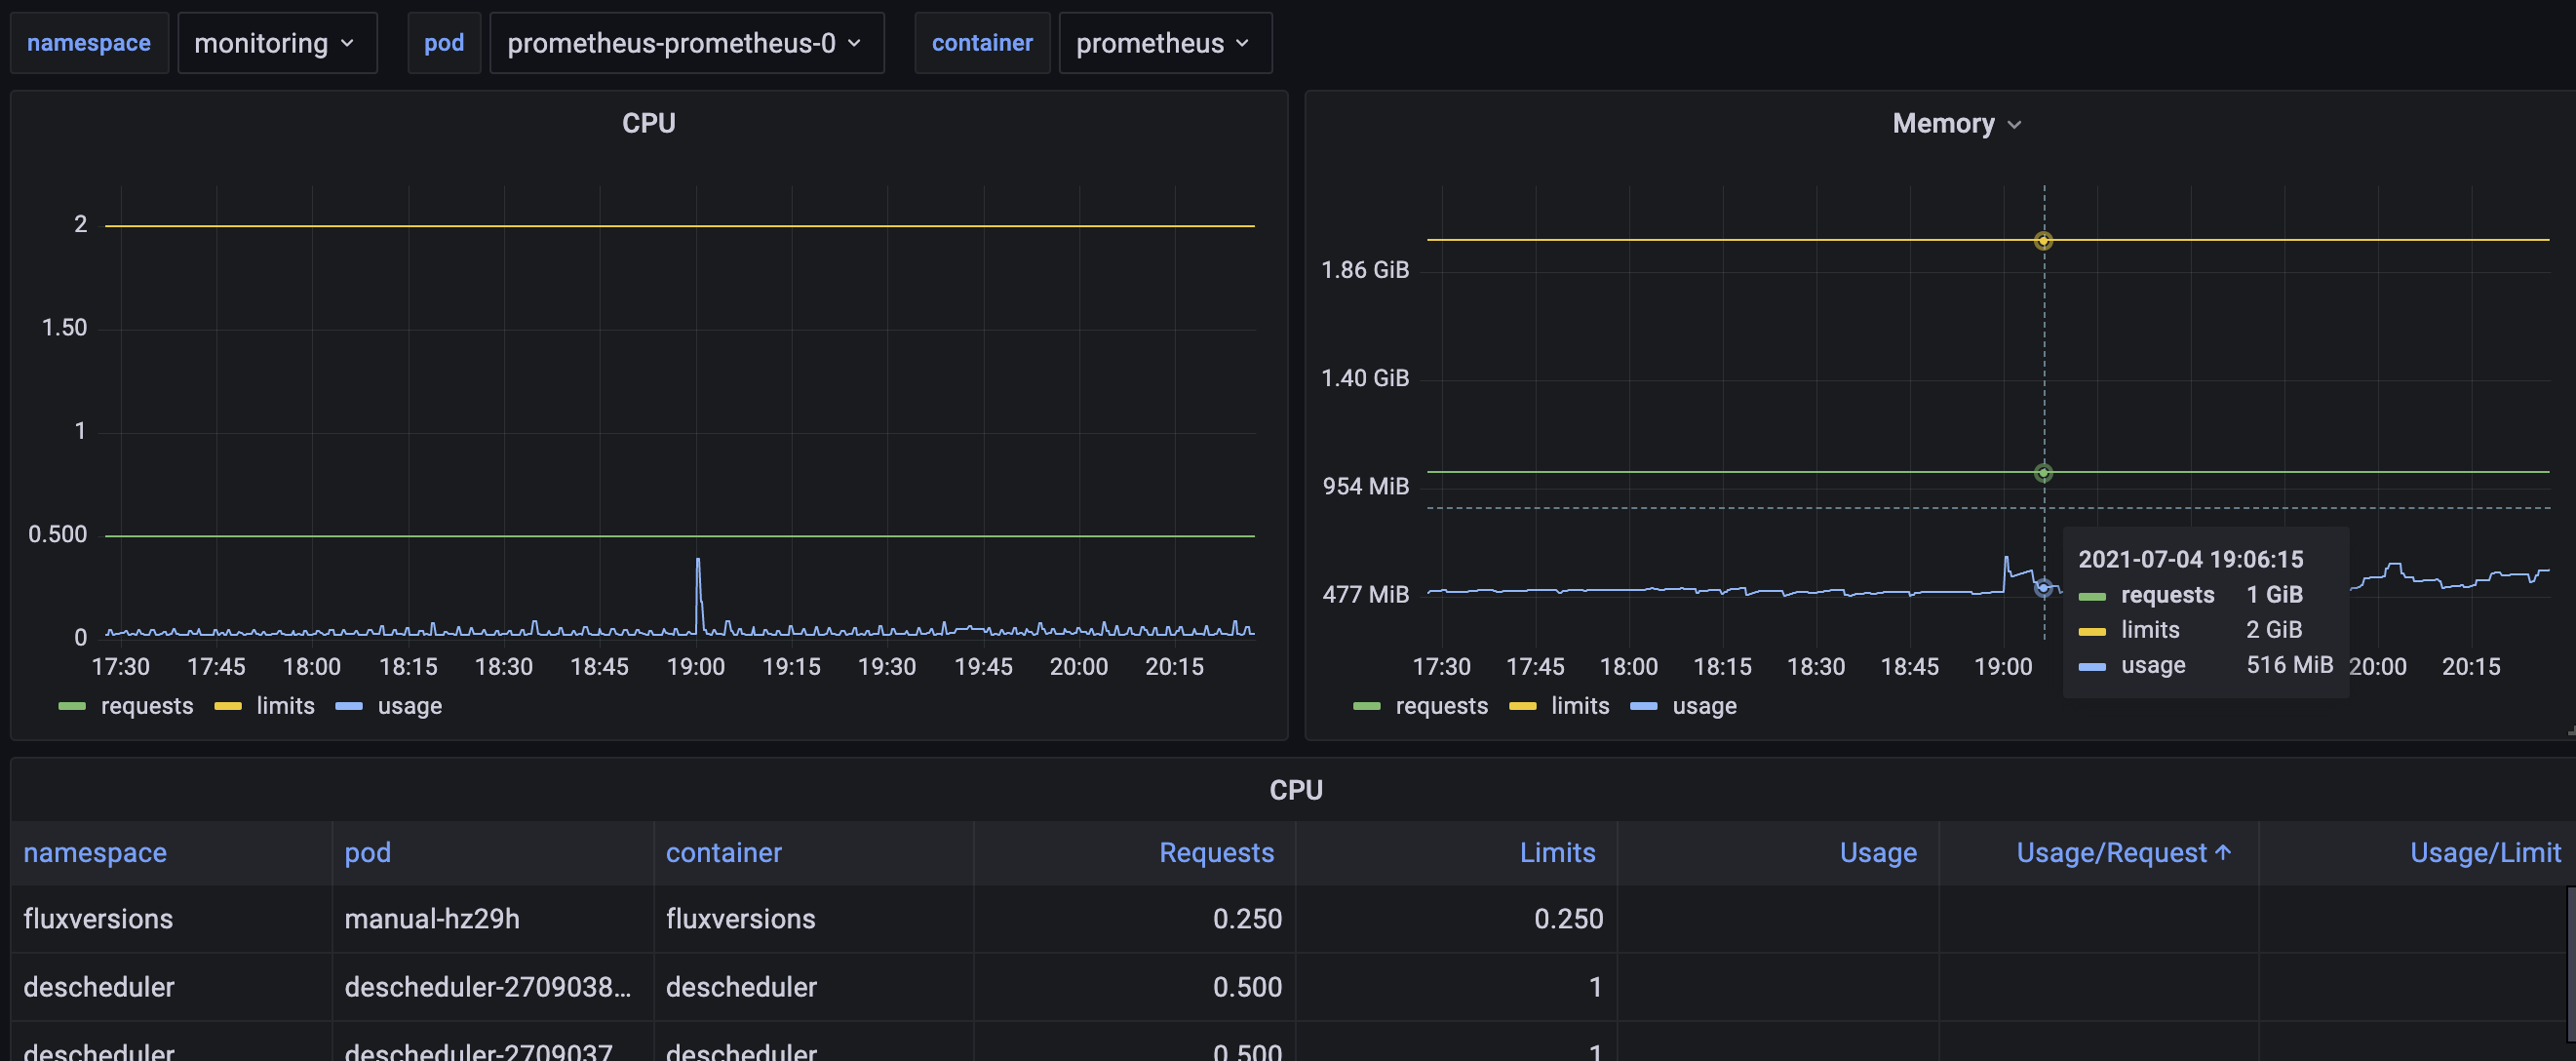
Overview of requests, limits and usage of containers. Similar to what "kube-eagle" offers, but this dashboard relies on kube-state-metrics and kubelet/cadvisor.
Screenshots
Used Metrics 44
-
container_cpu_usage_seconds_total
-
container_memory_working_set_bytes
kube_pod_container_resource_limits
kube_pod_container_resource_requests
Get Dashboard✕
Download
Copy to Clipboard