Container CPU Usage vs Throttling Percentage 73,99073,990
3/4/2020
3/4/2020
1
>=6.5.2
Description
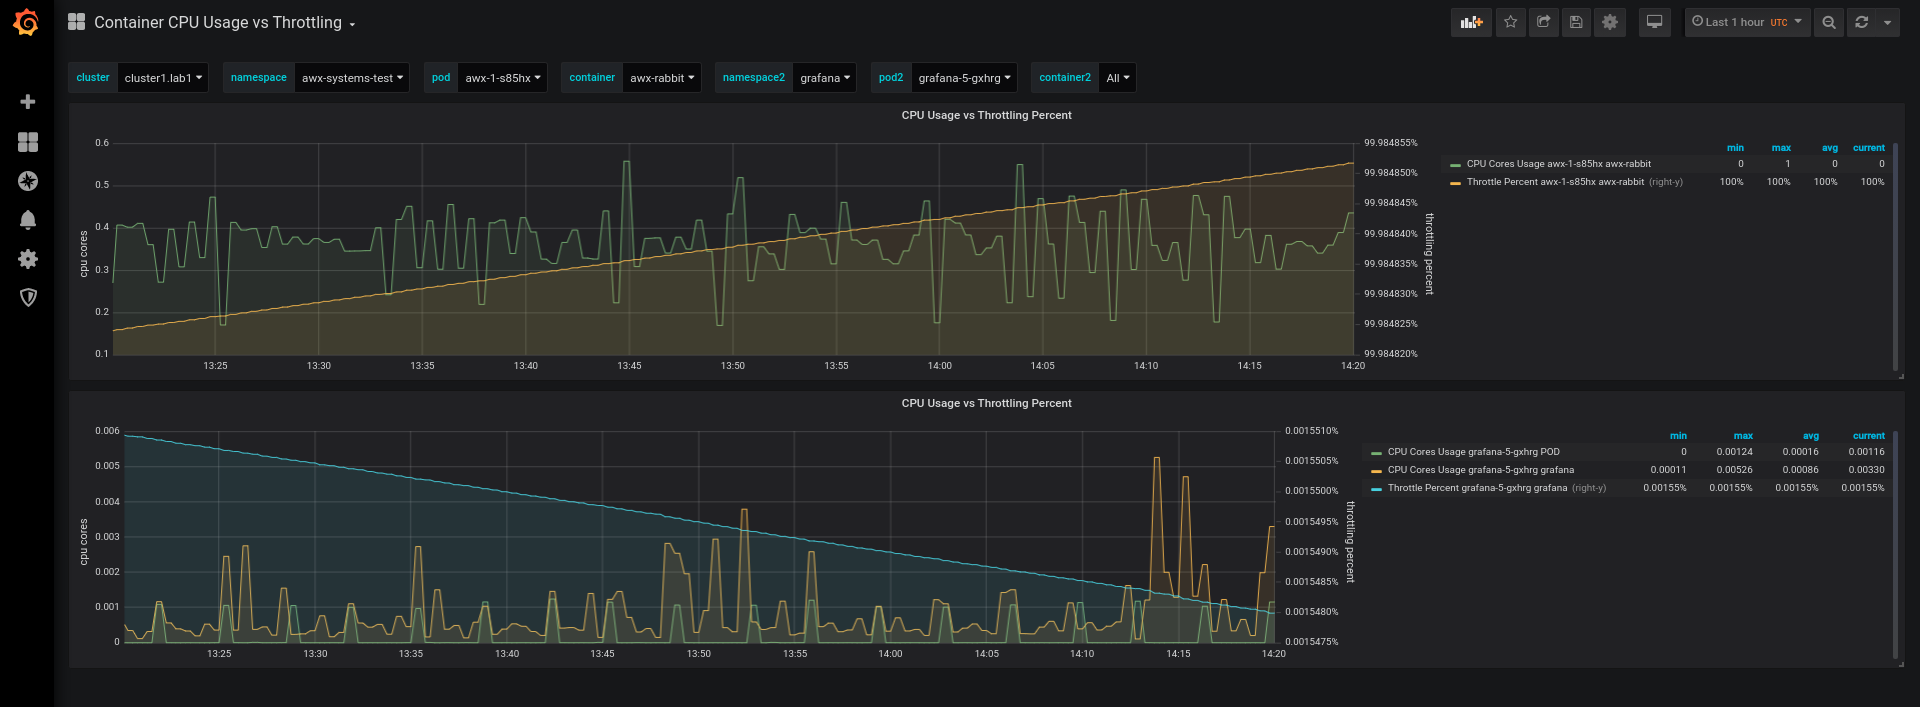
This dashboard monitors container CPU utilization alongside throttling behavior to highlight how CPU limits affect performance. It primarily uses container_cpu_usage_seconds_total, container_cpu_cfs_throttled_periods_total, and container_cpu_cfs_periods_total to show how much CPU time is consumed versus how often throttling occurs, enabling you to identify contention and efficiency. Key features include correlation between usage and throttling, trend detection over time, and concise metric-only panels to quickly assess container CPU pressure.
Screenshots
Get Dashboard✕
Download
Copy to Clipboard