Consul Server Monitoring 7,8817,881 4.0 (1 reviews)
Consul Server Monitoring Dashboard
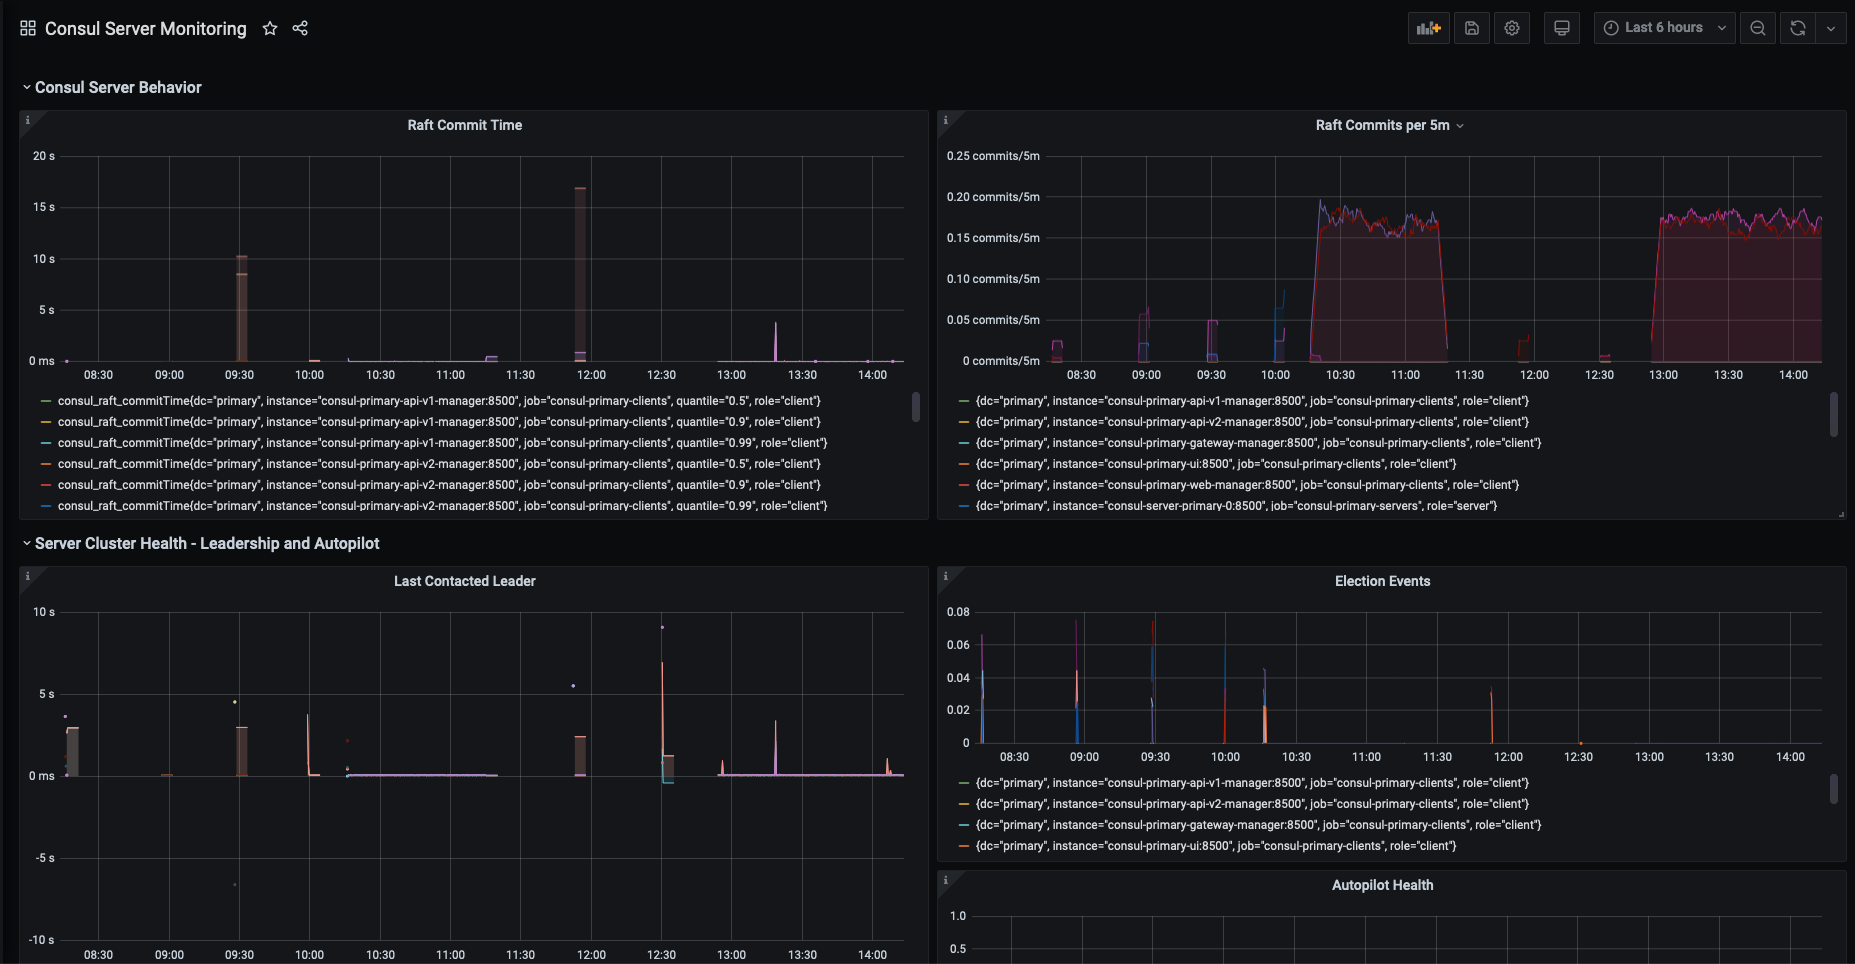
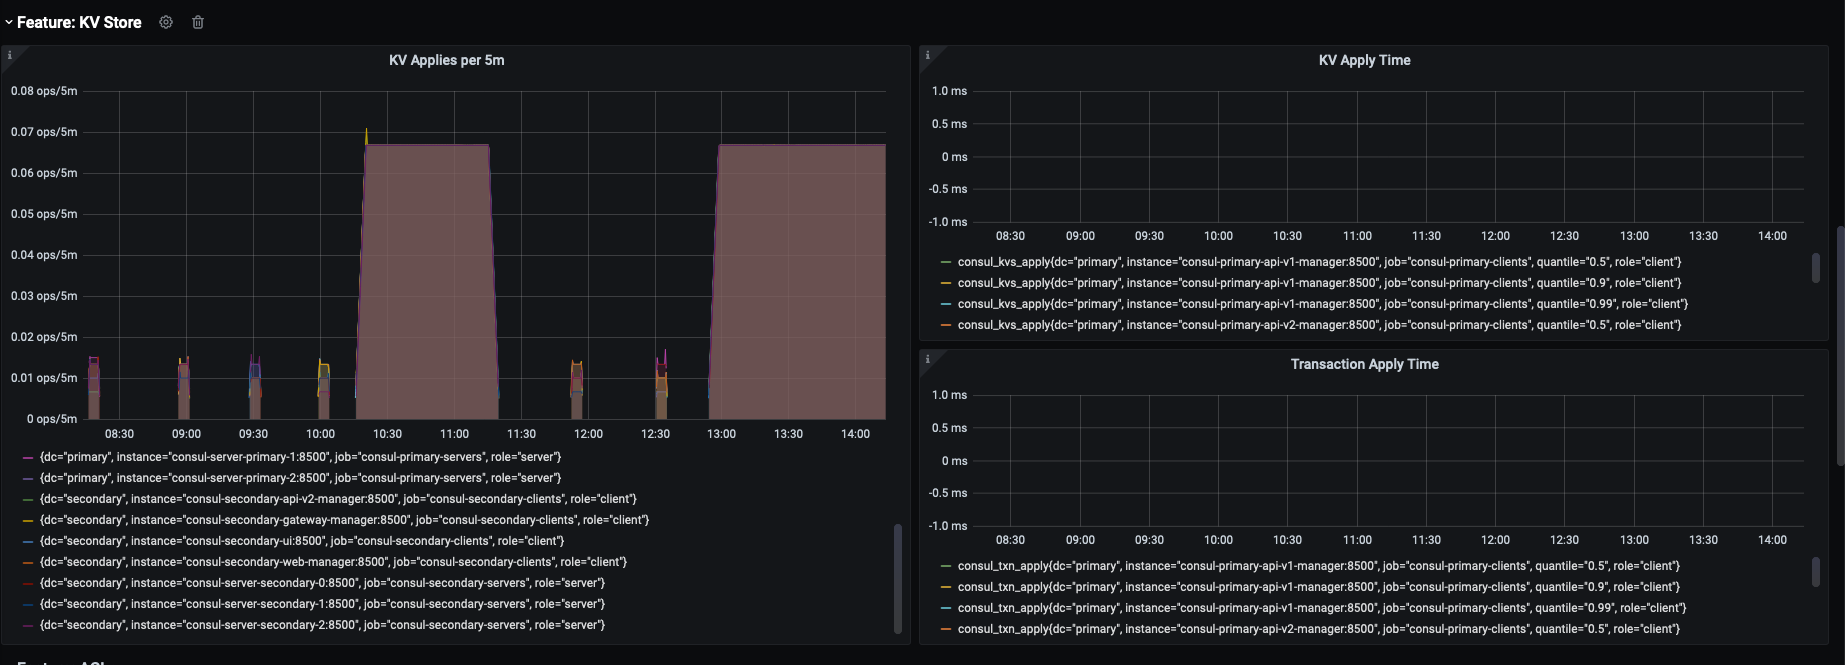
Maintained by the Consul team at HashiCorp. Displays critical health metrics about Consul servers, which are key to understanding Consul servers' behavior and stability in production. Also offers pre-built sections and panels for understanding usage of Consul by feature such as: KVs, DNS, the Catalog, and ACLs.
Critical metrics are based on the "key metrics" section in Consul's telemetry docs: https://www.consul.io/docs/agent/telemetry.html See these docs for more information on individual stats. If you have any questions, please reach out on our community discuss board at: https://discuss.hashicorp.com/c/consul/29
Due to Consul's architecture, some metrics are emitted on both server and client agents. Typical deploys have many more clients than servers running, which can add noise when monitoring Consul server health. To filter it down, we recommend adding labels in prometheus' scrape_config based on the consul's agent's role on the host. E.g. role="server" for Consul servers and role="client" for Consul client agents. This will allow you to adapt the panel queries to filter on role="server", showing only the timeseries emitted from servers. https://prometheus.io/docs/prometheus/latest/configuration/configuration/#scrape_config
Used Metrics 2020
consul_raft_commitTime
consul_raft_apply
consul_raft_leader_lastContact
consul_raft_state_candidate
consul_raft_state_leader
consul_autopilot_healthy
consul_dns_domain_query_count
consul_dns_domain_query
consul_dns_ptr_query
consul_kvs_apply_count
consul_kvs_apply
consul_txn_apply
consul_acl_ResolveToken_count
consul_acl_ResolveToken
consul_acl_apply_count
consul_acl_apply
consul_catalog_register_count
consul_catalog_deregister_count
consul_catalog_register
consul_catalog_deregister