Consul 5,9865,986 5.0 (1 reviews)
5/27/2017
5/28/2017
1
Databases
>=4.3.0-beta1
Prometheus
Description
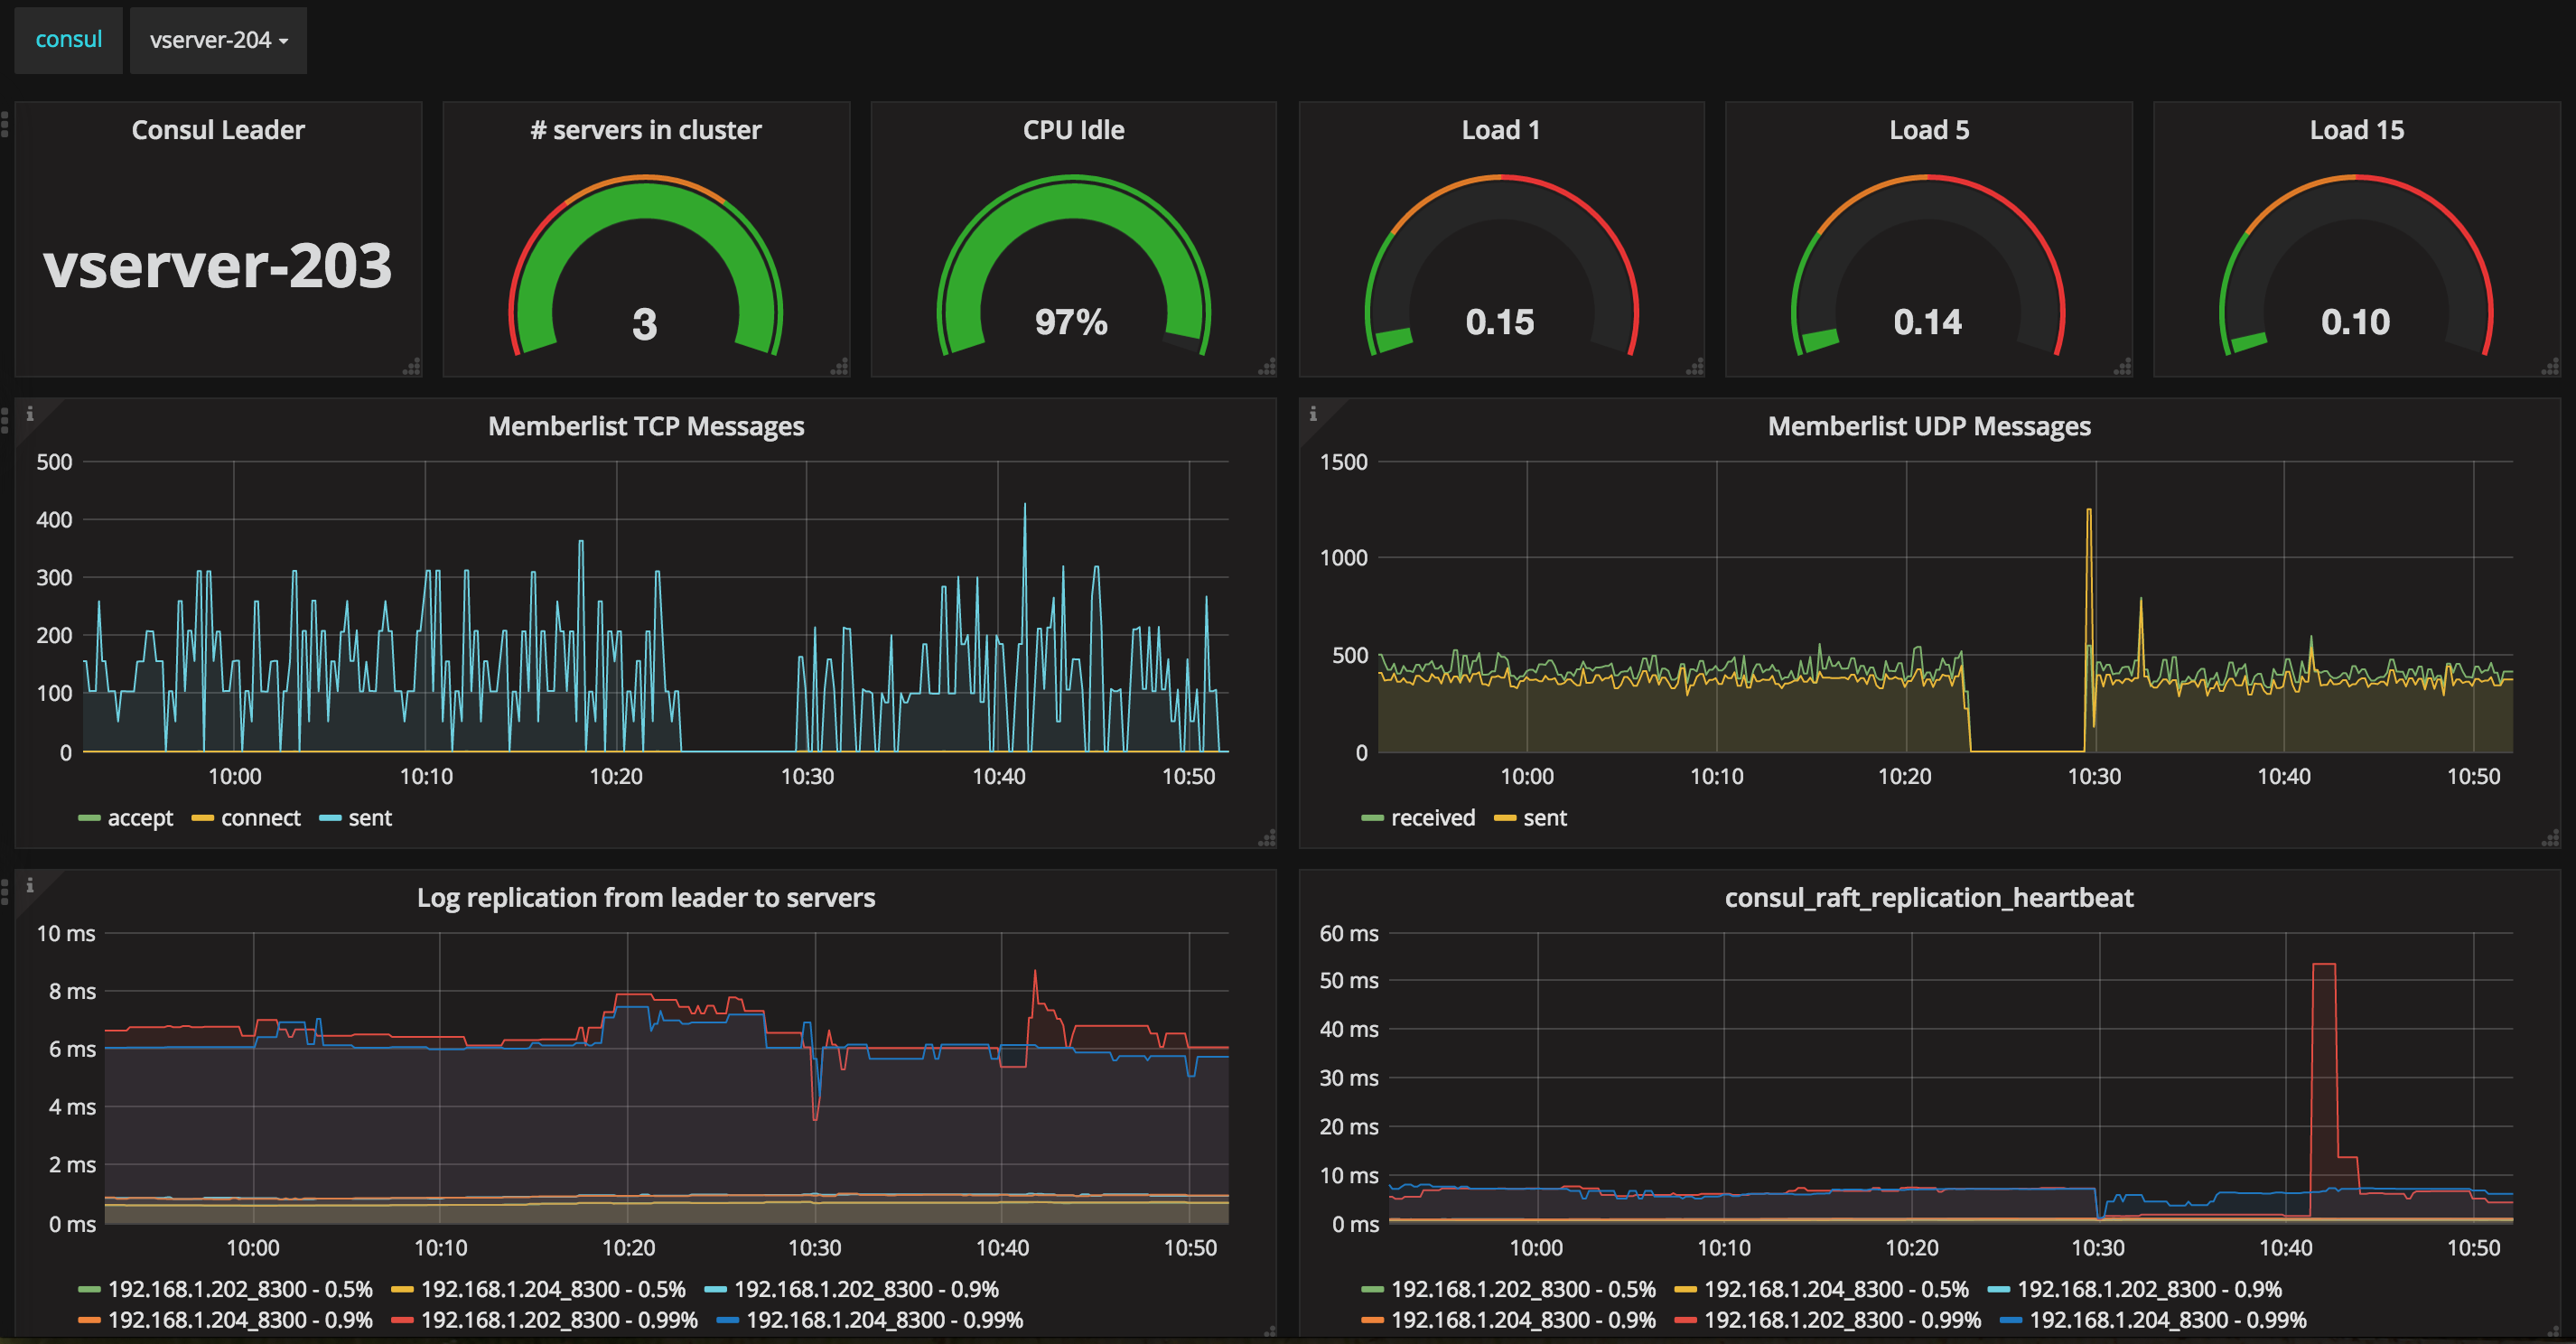
Get performance metrics from Consul
Screenshots
Get Dashboard✕
Download
Copy to Clipboard
Get performance metrics from Consul