ClusterPolicyReport Details 24,870,21624,870,216
3/3/2021
10/23/2023
5
>=10.1.5
Prometheus
Description
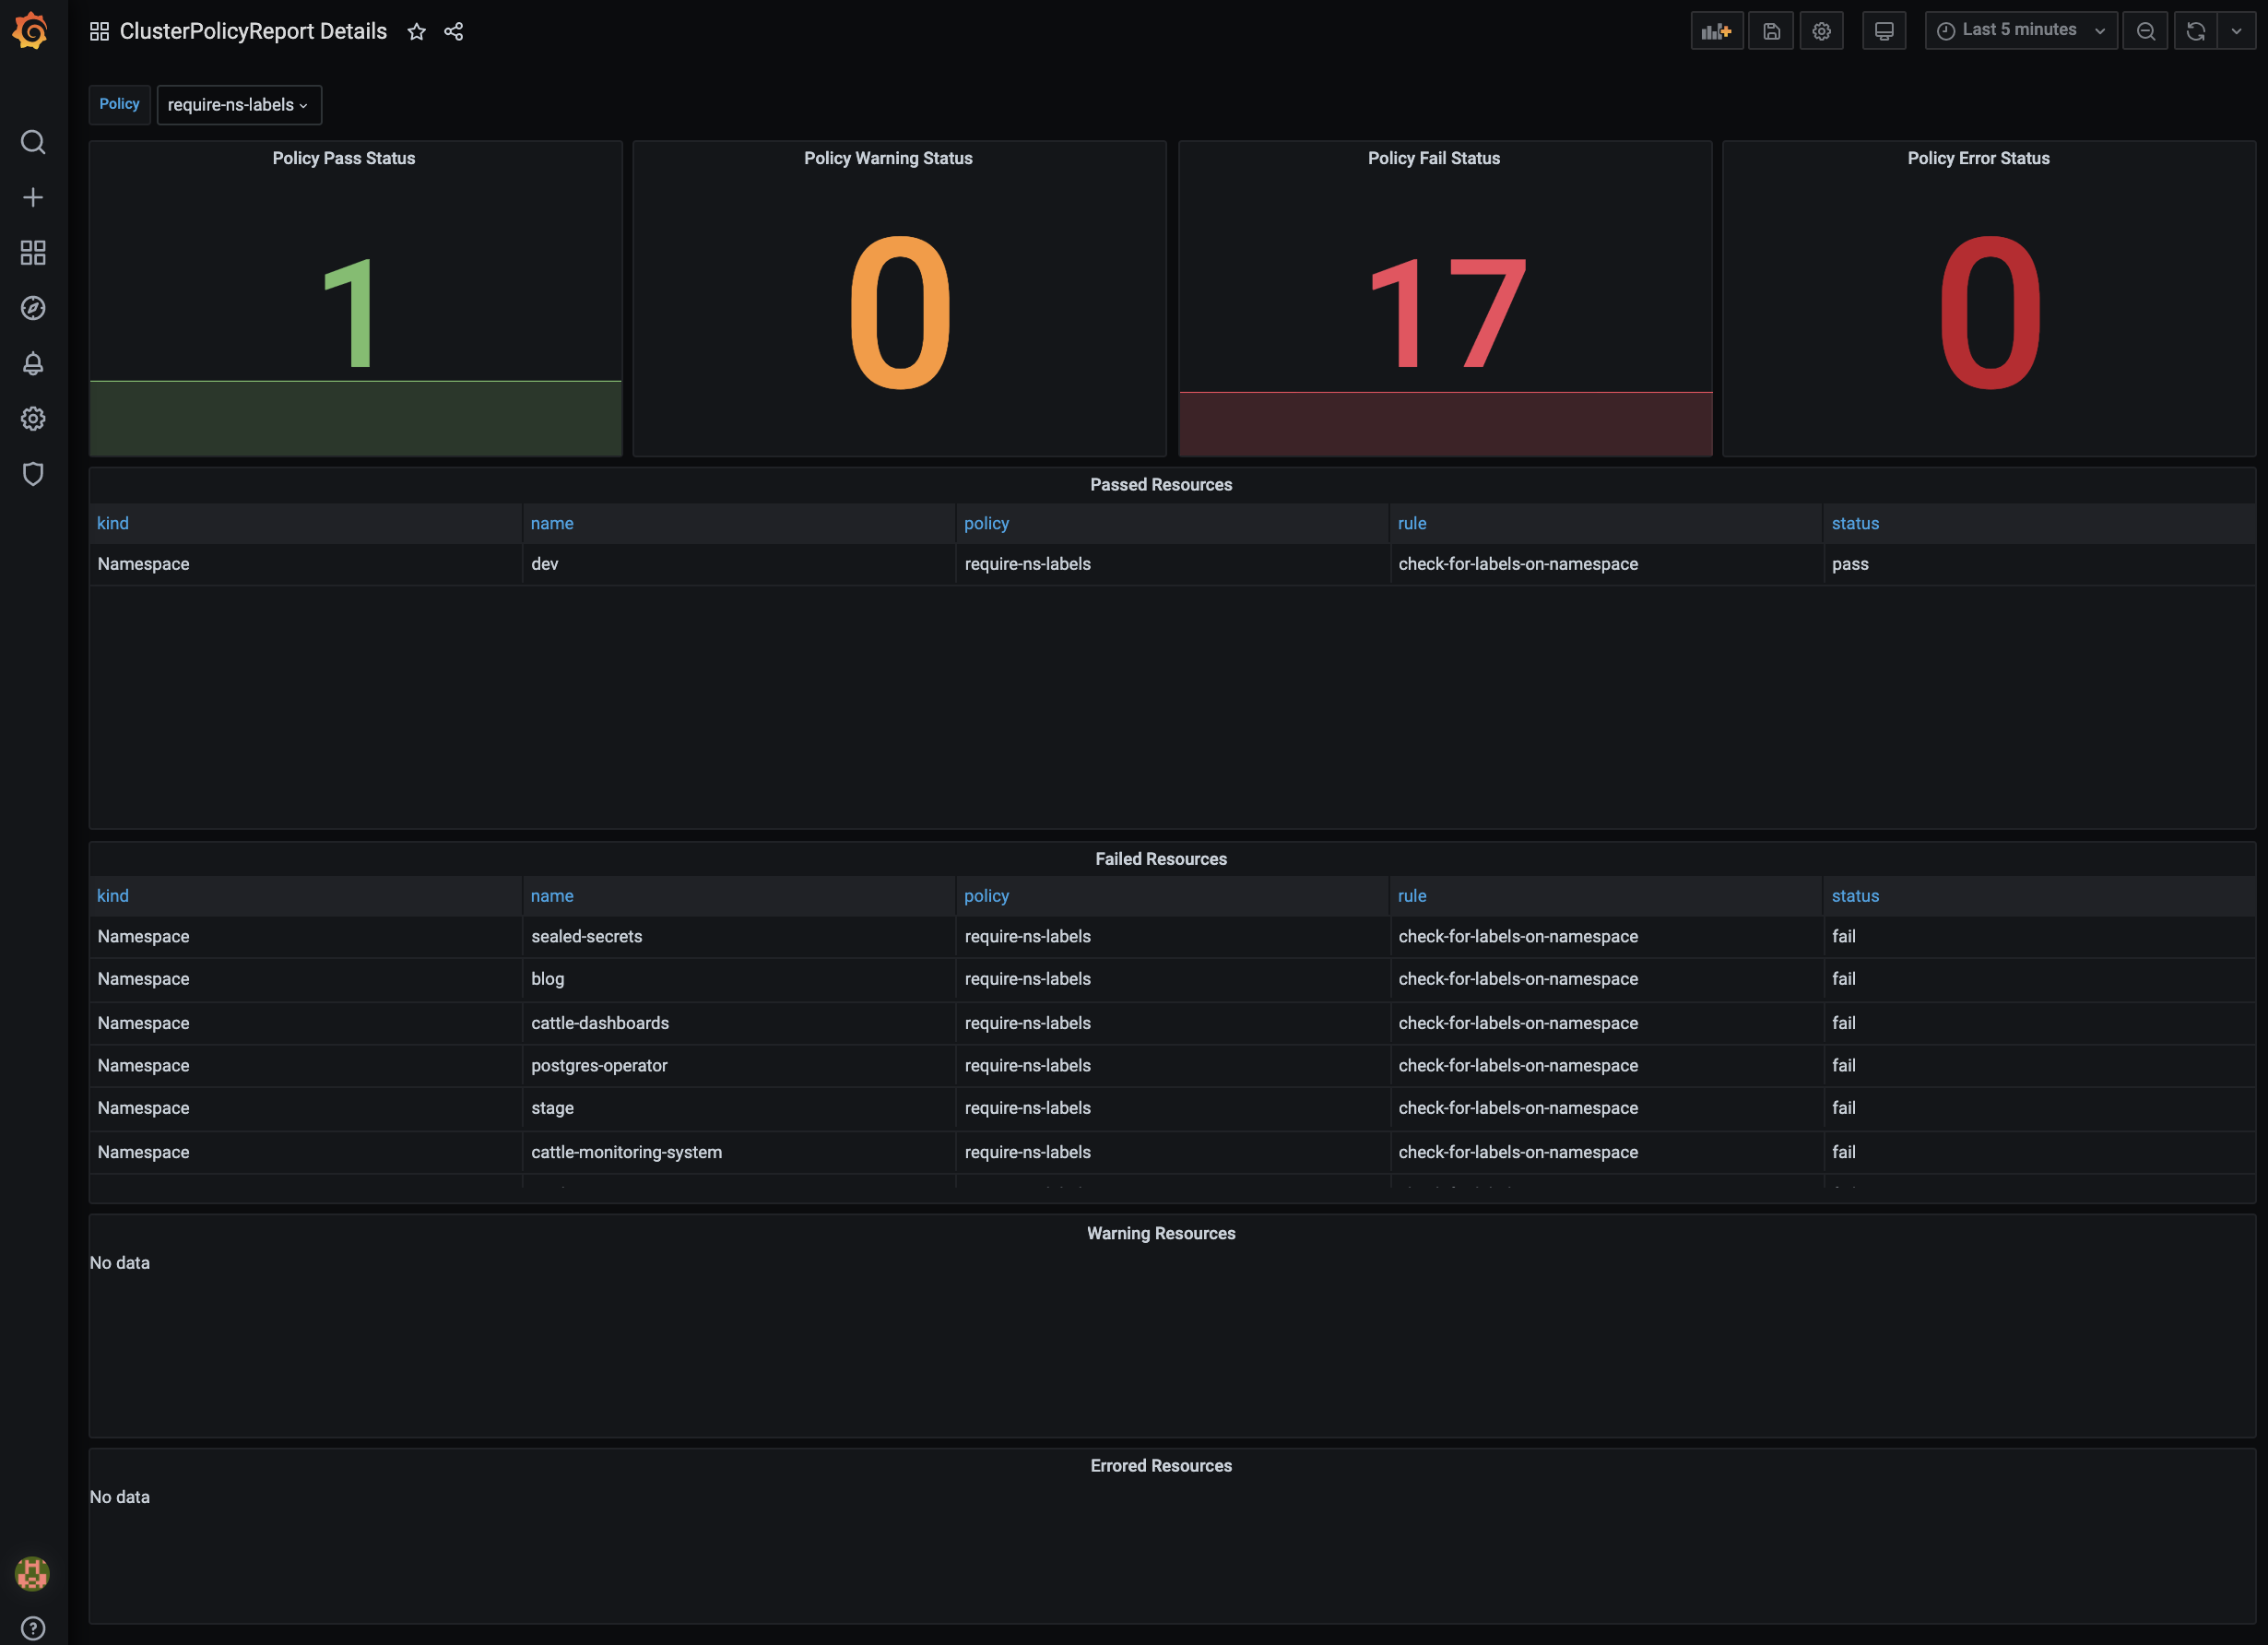
This dashboard provides a concise, at-a-glance view of cluster policy evaluations using the cluster_policy_report_result metric. It tracks pass, warn, fail, and error outcomes across resources, with a timeline to observe trends and panels listing Passed, Failed, Warning, and Errored Resources. Key features include status-specific panels (Policy Pass/Warning/Fail/Error Status) and a Status Timeline to correlate policy results over time, enabling rapid identification of policy breaches and resource-level impact.
Screenshots
Used Metrics 11
cluster_policy_report_result
Get Dashboard✕
Download
Copy to Clipboard