Cluster Overview 1,9621,962
Description
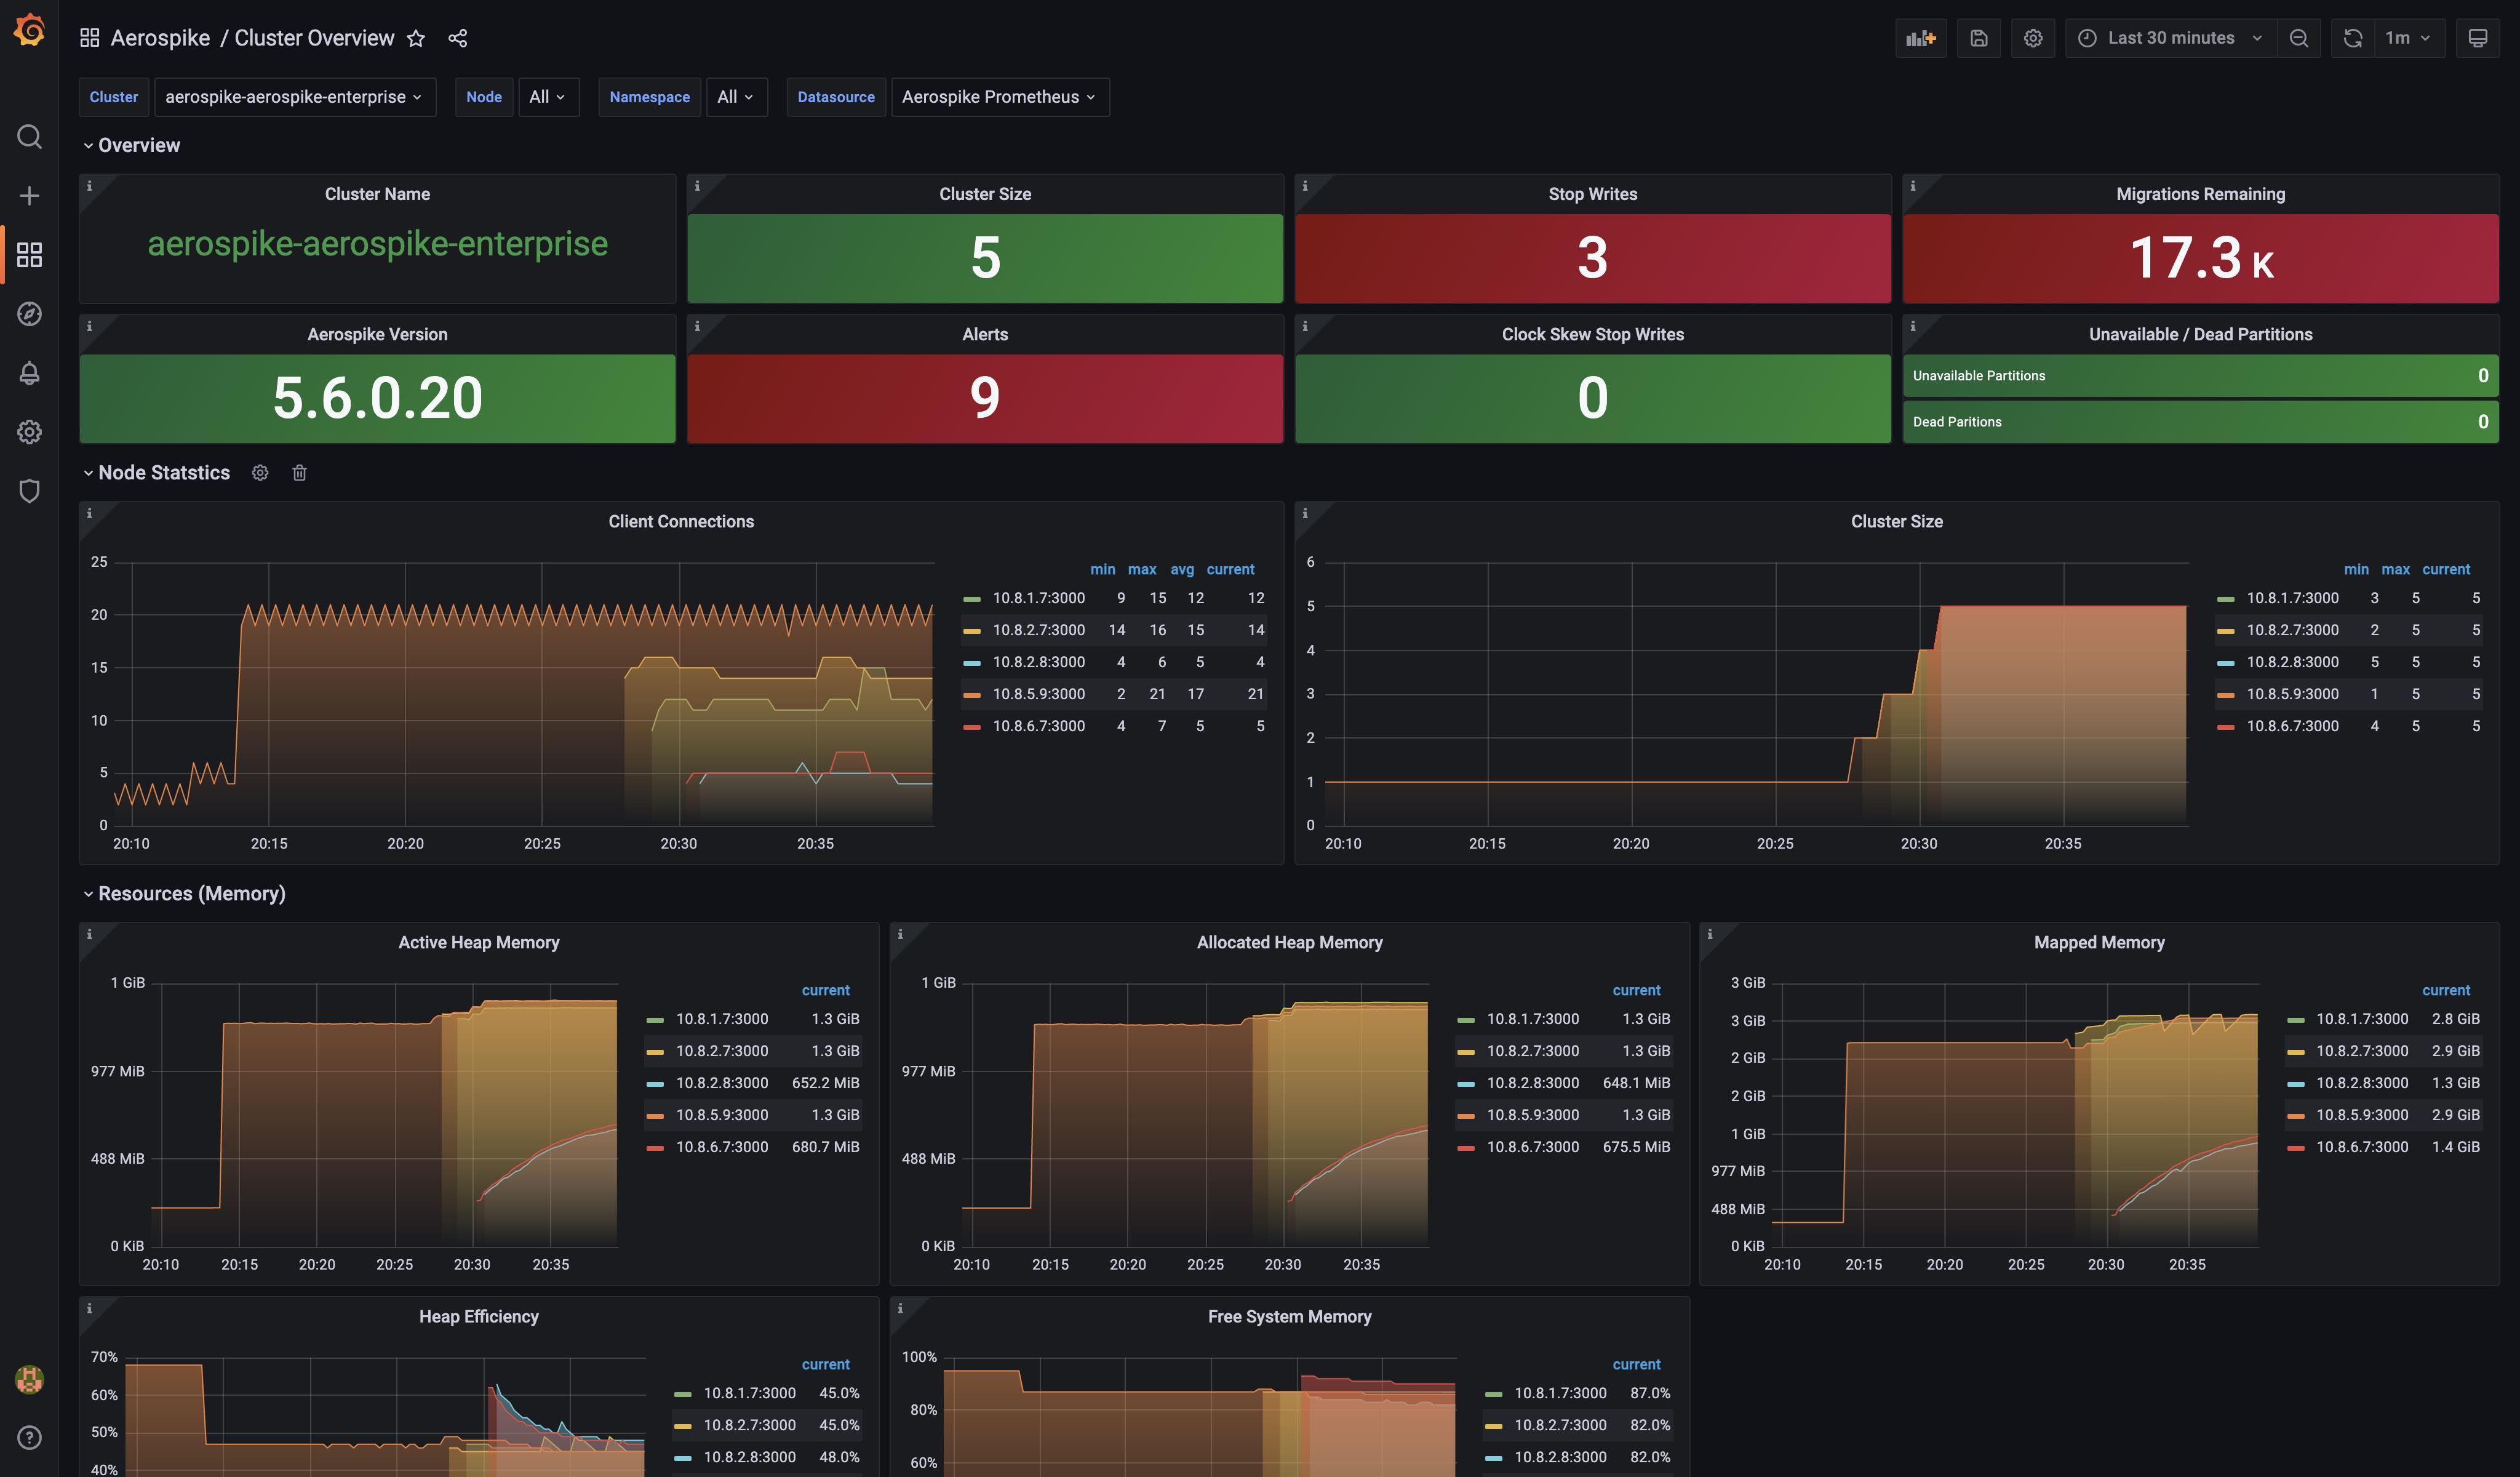
Cluster Overview dashboard helps visualise multiple cluster and their metrics with a focus on resources
Screenshots
Used Metrics 3131
ALERTS
aerospike_namespace_batch_sub_read_error
aerospike_namespace_batch_sub_read_not_found
aerospike_namespace_batch_sub_read_success
aerospike_namespace_batch_sub_read_timeout
aerospike_namespace_batch_sub_write_error
aerospike_namespace_batch_sub_write_success
aerospike_namespace_batch_sub_write_timeout
aerospike_namespace_client_read_error
aerospike_namespace_client_read_not_found
aerospike_namespace_client_read_success
aerospike_namespace_client_read_timeout
aerospike_namespace_client_write_error
aerospike_namespace_client_write_success
aerospike_namespace_client_write_timeout
aerospike_namespace_clock_skew_stop_writes
aerospike_namespace_dead_partitions
aerospike_namespace_hwm_breached
aerospike_namespace_migrate_rx_partitions_active
aerospike_namespace_migrate_rx_partitions_remaining
aerospike_namespace_migrate_tx_partitions_active
aerospike_namespace_migrate_tx_partitions_remaining
aerospike_namespace_stop_writes
aerospike_namespace_unavailable_partitions
aerospike_node_stats_cluster_size
aerospike_node_stats_pseudo_log_debug
aerospike_node_stats_pseudo_log_detail
aerospike_node_up
build_numbers
cluster
size