Cluster Monitoring for Kubernetes 1,375,1911,375,191 4.7 (9 reviews)
4/2/2019
8/8/2019
1
Host Metrics
>=5.3.2
Prometheus
Description
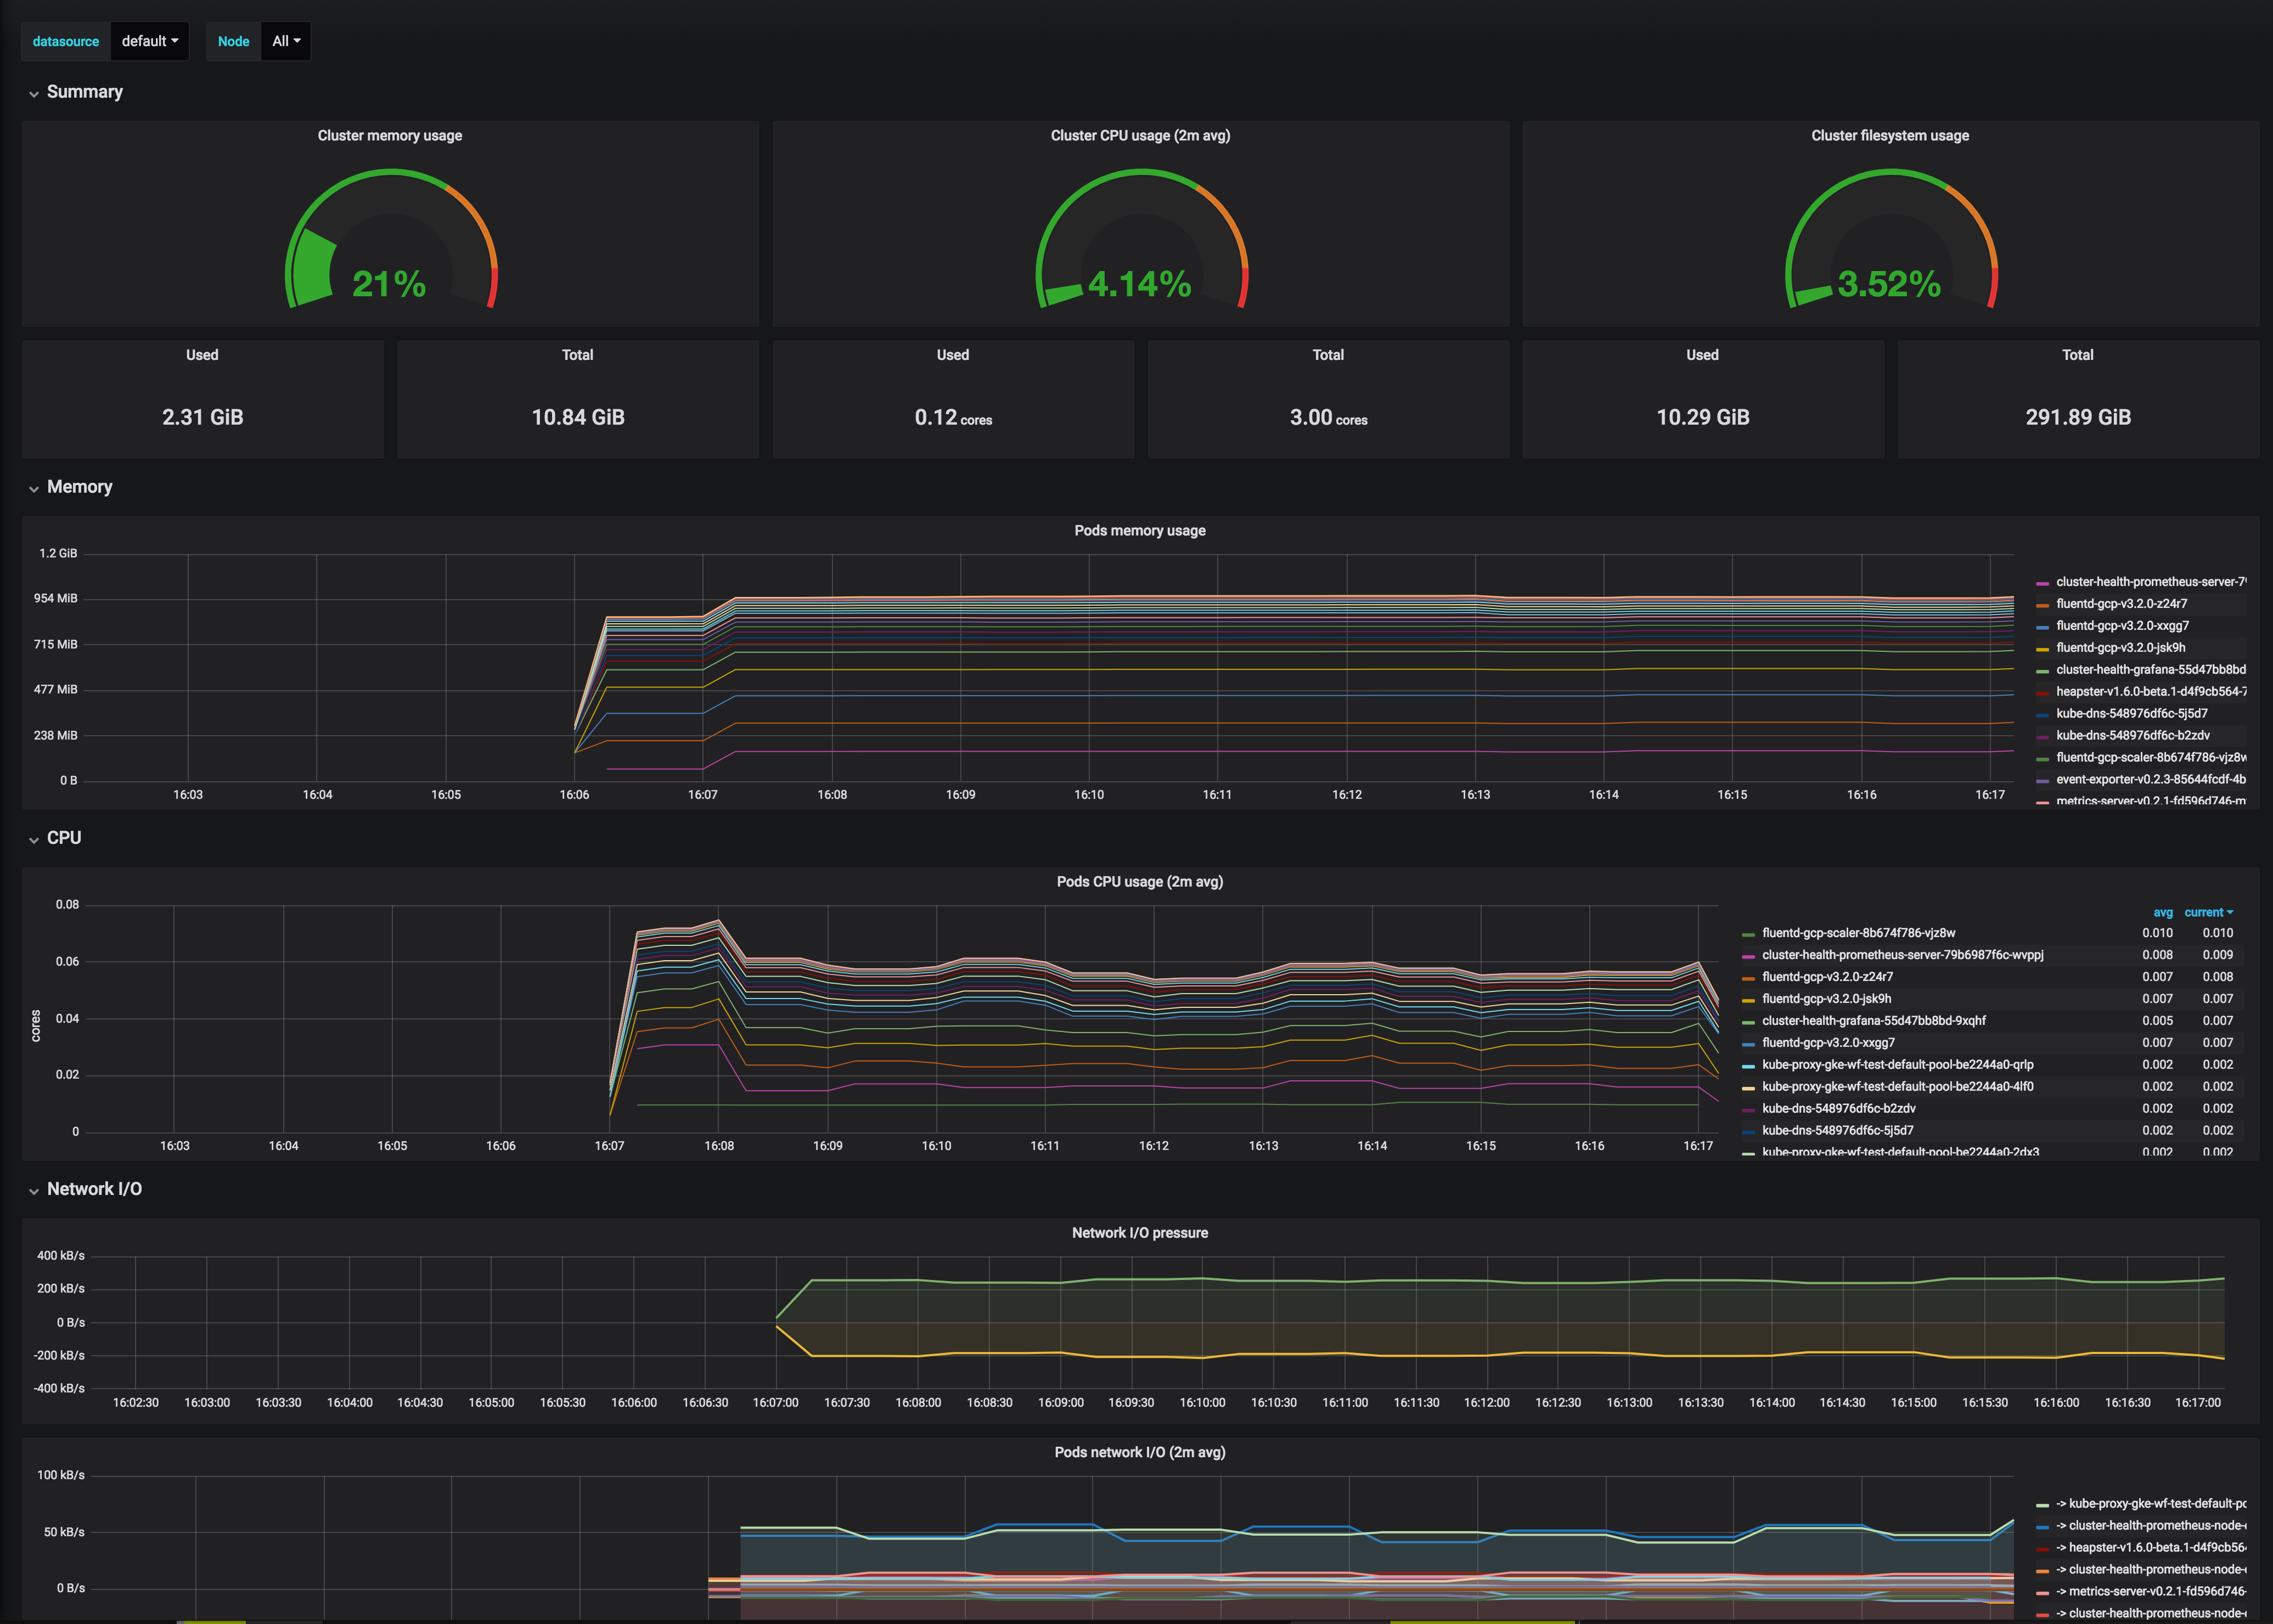
This dashboard monitors Kubernetes cluster health and resource utilization, aggregating core metrics to reveal memory, CPU, filesystem, pod-level, and network activity. It emphasizes time-series insights with panels like Cluster memory usage, Cluster CPU usage ($interval avg), Cluster filesystem usage, and Pods CPU usage ($interval avg), along with network I/O pressure indicators. Key metrics include container_memory_working_set_bytes and machine_memory_bytes for memory, container_cpu_usage_seconds_total and machine_cpu_cores for CPU, and container_fs_usage_bytes/container_fs_limit_bytes for filesystem, plus container_network_receive_bytes_total and container_network_transmit_bytes_total for network throughput.
Screenshots
Get Dashboard✕
Download
Copy to Clipboard