Cluster: Goldpinger 65,32765,327
10/2/2019
10/2/2019
1
>=6.1.6
Prometheus
Description
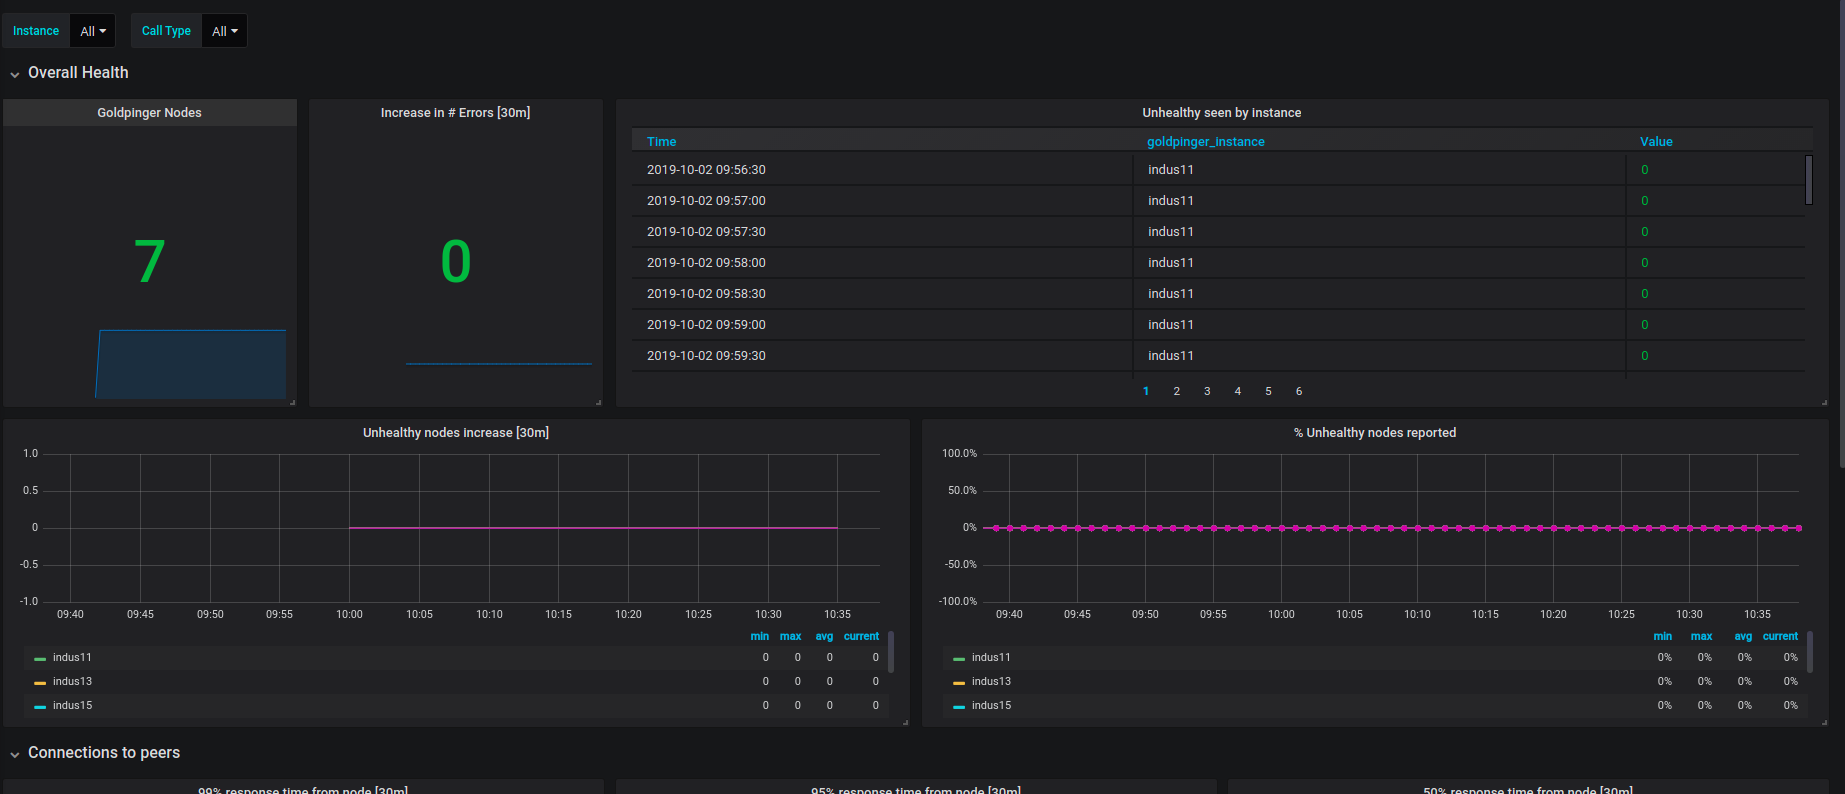
This dashboard monitors the health and responsiveness of a Goldpinger-based cluster, distinguishing node health, error rates, and response-time dispersion. It emphasizes latency and reliability by tracking goldpinger_nodes_health_total, goldpinger_errors_total, and bucketed response times like goldpinger_peers_response_time_s_bucket (as well as goldpinger_kube_master_response_time_s_bucket for API latency) to surface both current health and trend changes over 30-minute windows.
Screenshots
Used Metrics 44
goldpinger_errors_total
goldpinger_kube_master_response_time_s_bucket
goldpinger_nodes_health_total
goldpinger_peers_response_time_s_bucket
Get Dashboard✕
Download
Copy to Clipboard