Cluster / Global performance 30,73630,736
Description
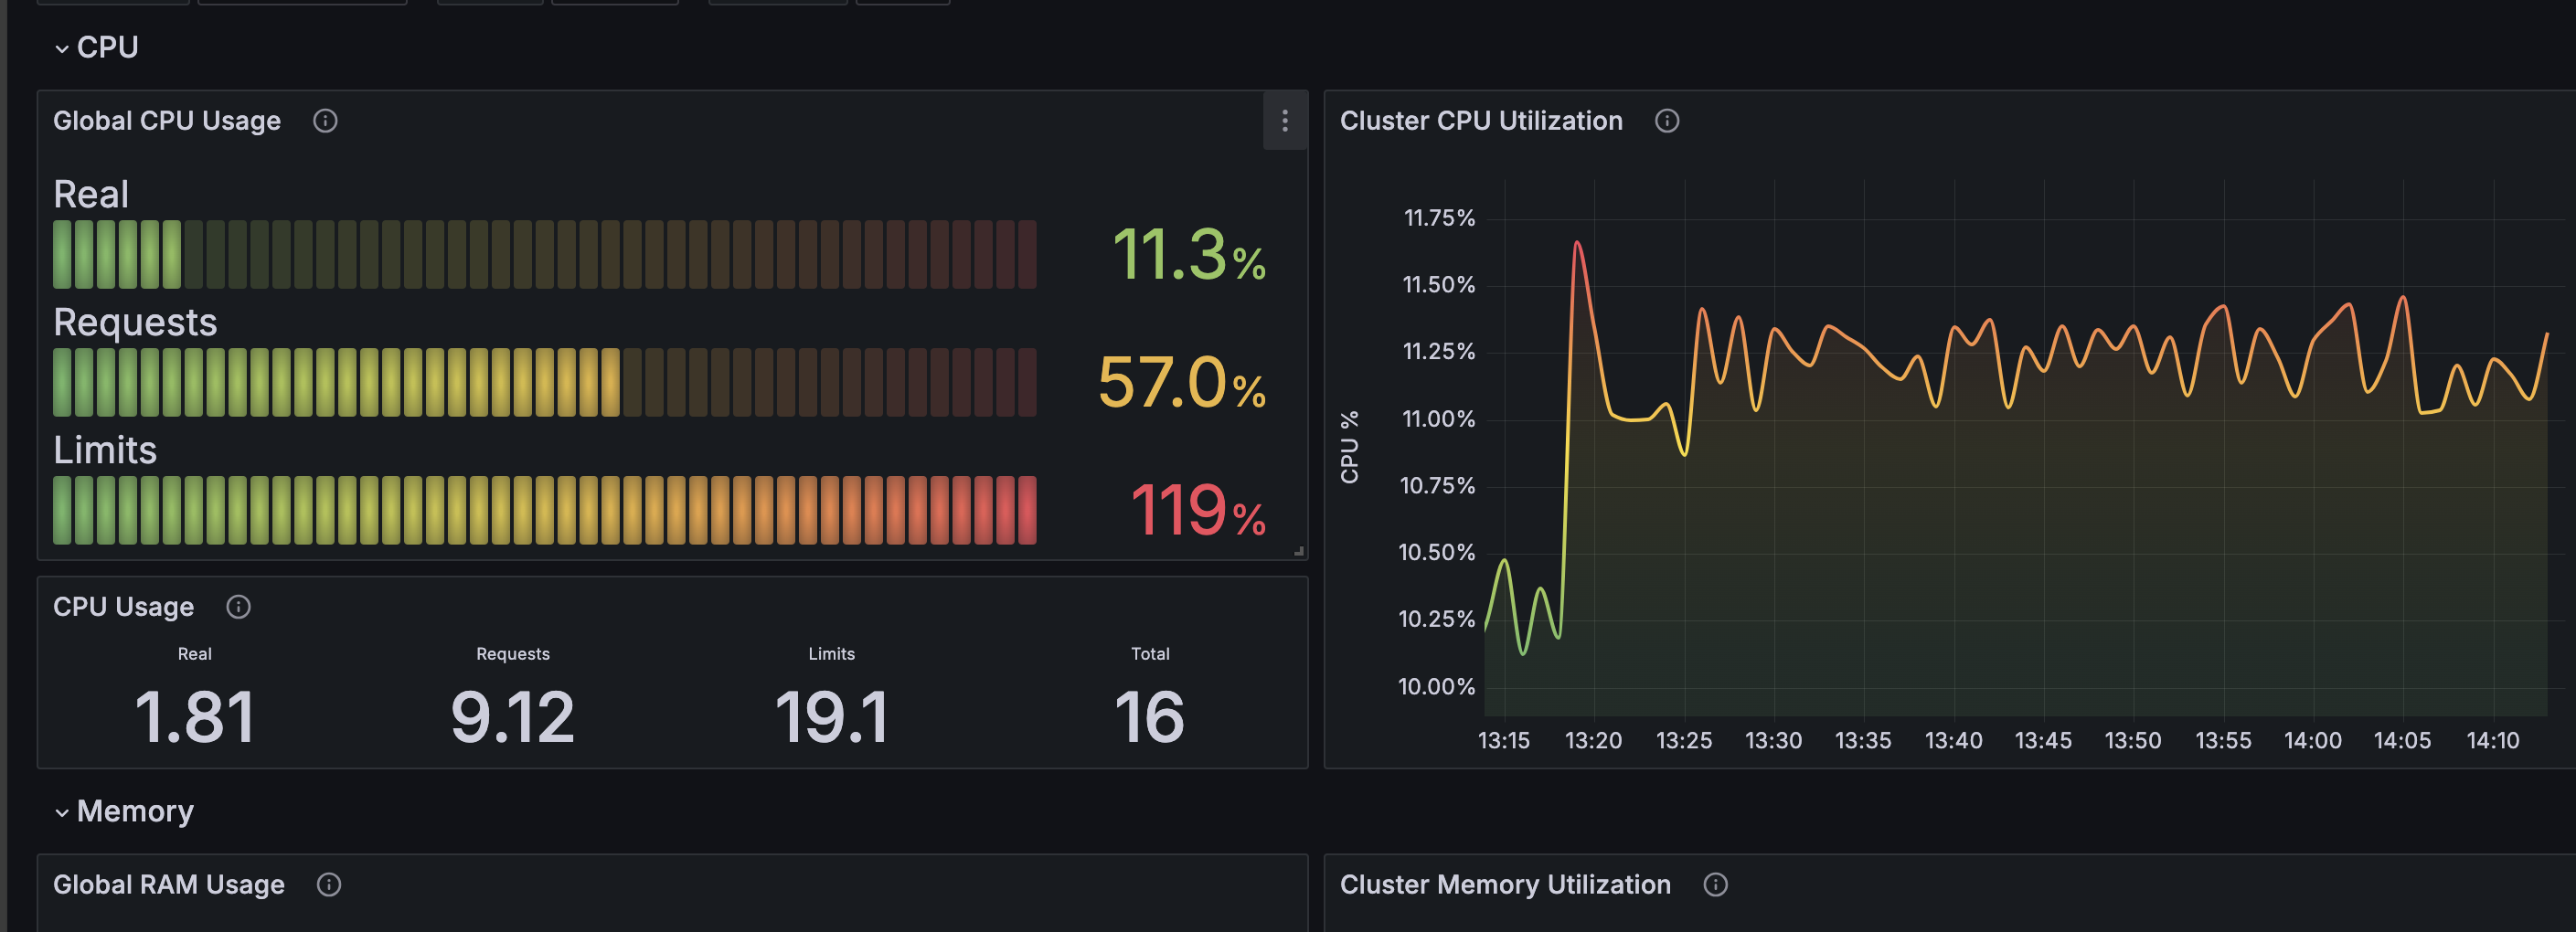
This Grafana dashboard offers a detailed overview of Kubernetes cluster performance and resource usage. It features time series graphs that monitor various metrics, including the number of namespaces, running pods, RAM usage, CPU usage and other key Kubernetes resources such as services, endpoints, and deployments. The dashboard also tracks persistent volume usage both as a percentage and in gigabytes, providing insights into storage utilization. Additionally, it visualizes network usage, covering both bytes and packets per second for incoming and outgoing traffic.
Screenshots
Used Metrics 3030
kube_configmap_info
kube_daemonset_labels
kube_deployment_labels
kube_endpoint_info
kube_hpa_labels
kube_ingress_info
kube_namespace_created
kube_namespace_labels
kube_networkpolicy_labels
kube_node_info
kube_persistentvolumeclaim_info
kube_pod_container_resource_limits
kube_pod_container_resource_requests
kube_pod_container_status_running
kube_pod_status_phase
kube_secret_info
kube_service_info
kube_statefulset_labels
kubelet_volume_stats_capacity_bytes
kubelet_volume_stats_used_bytes
-
machine_cpu_cores
-
machine_memory_bytes
-
node_cpu_seconds_total
-
node_memory_MemAvailable_bytes
-
node_memory_MemTotal_bytes
-
node_network_receive_bytes_total
-
node_network_receive_packets_total
-
node_network_transmit_bytes_total
-
node_network_transmit_packets_total
resolution