Cluster cost & utilization metrics 182,179182,179 3.3 (4 reviews)
Description
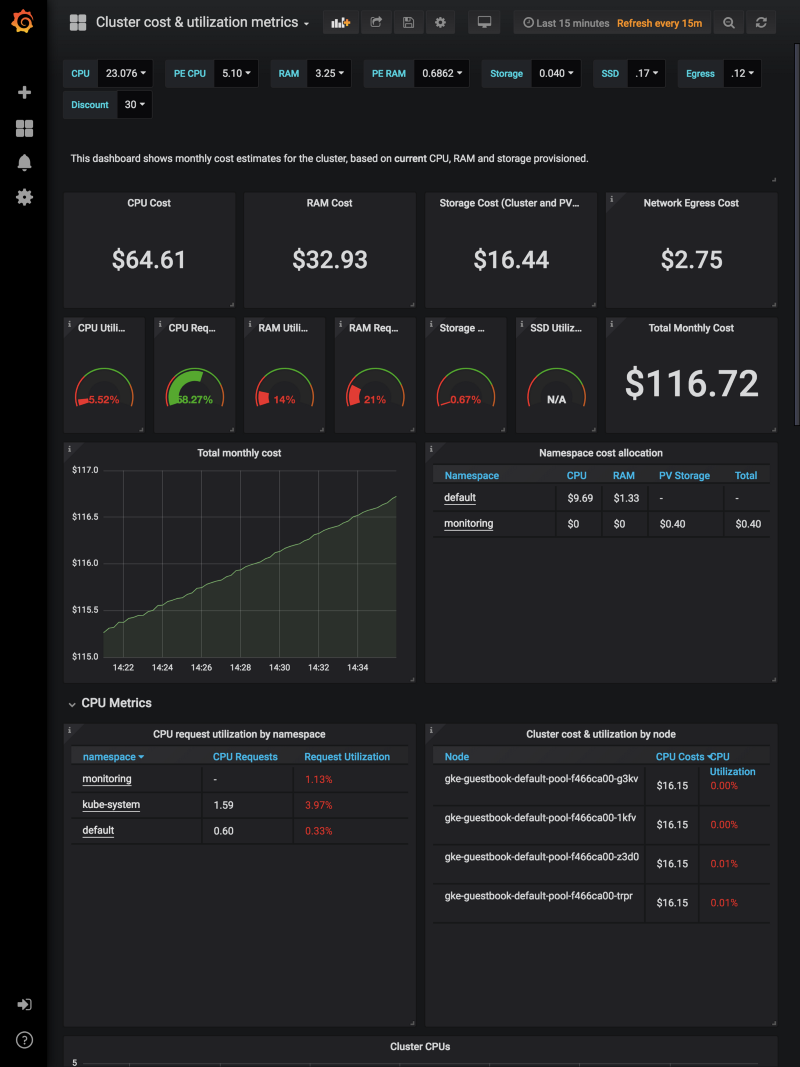
This dashboard monitors cluster cost and utilization with a focus on compute, memory, storage, and network expenses alongside utilization metrics. It highlights costed resources and capacity, including costpcpu / costpram / costram alongside utilization signals like kube_node_status_capacity_cpu_cores and kube_node_status_capacity_memory_bytes to show how efficiently resources are being consumed. Key features include per-namespace cost allocation, node-level breakdowns (e.g., Cluster cost & utilization by node), and time-series trends for total monthly costs and utilization metrics across CPU, RAM, storage, and SSD.
Screenshots
Used Metrics 5353
CPU
END
Memory
Network
PV
RAM
STORAGE
Storage
-
container_cpu_usage_seconds_total
-
container_fs_limit_bytes
-
container_fs_usage_bytes
-
container_memory_usage_bytes
-
container_spec_cpu_shares
container_spec_memory_limit_bytes
costDiscount
costEgress
costStorageSSD
costStorageStandard
costcpu
costpcpu
costpram
costram
instance
kube_node_labels
kube_node_status_allocatable_cpu_cores
kube_node_status_allocatable_memory_bytes
kube_node_status_capacity_cpu_cores
kube_node_status_capacity_memory_bytes
kube_persistentvolumeclaim_info
kube_persistentvolumeclaim_resource_requests_storage_bytes
kube_pod_container_resource_limits_cpu_cores
kube_pod_container_resource_limits_memory_bytes
kube_pod_container_resource_requests_cpu_cores
kube_pod_container_resource_requests_memory_bytes
kube_pod_info
kubelet_volume_stats_inodes
kubelet_volume_stats_inodes_used
kubelet_volume_stats_used_bytes
label_cloud_google_com_gke_preemptible
node
-
node_cpu_seconds_total
node_disk_reads_completed
-
node_disk_reads_completed_total
node_disk_writes_completed
-
node_disk_writes_completed_total
-
node_memory_MemAvailable_bytes
-
node_memory_MemTotal_bytes
-
node_network_transmit_bytes_total
pod
pod_name
storage
storageclass
-
up