Cluster Capacity (Karpenter) 453,918453,918
Description
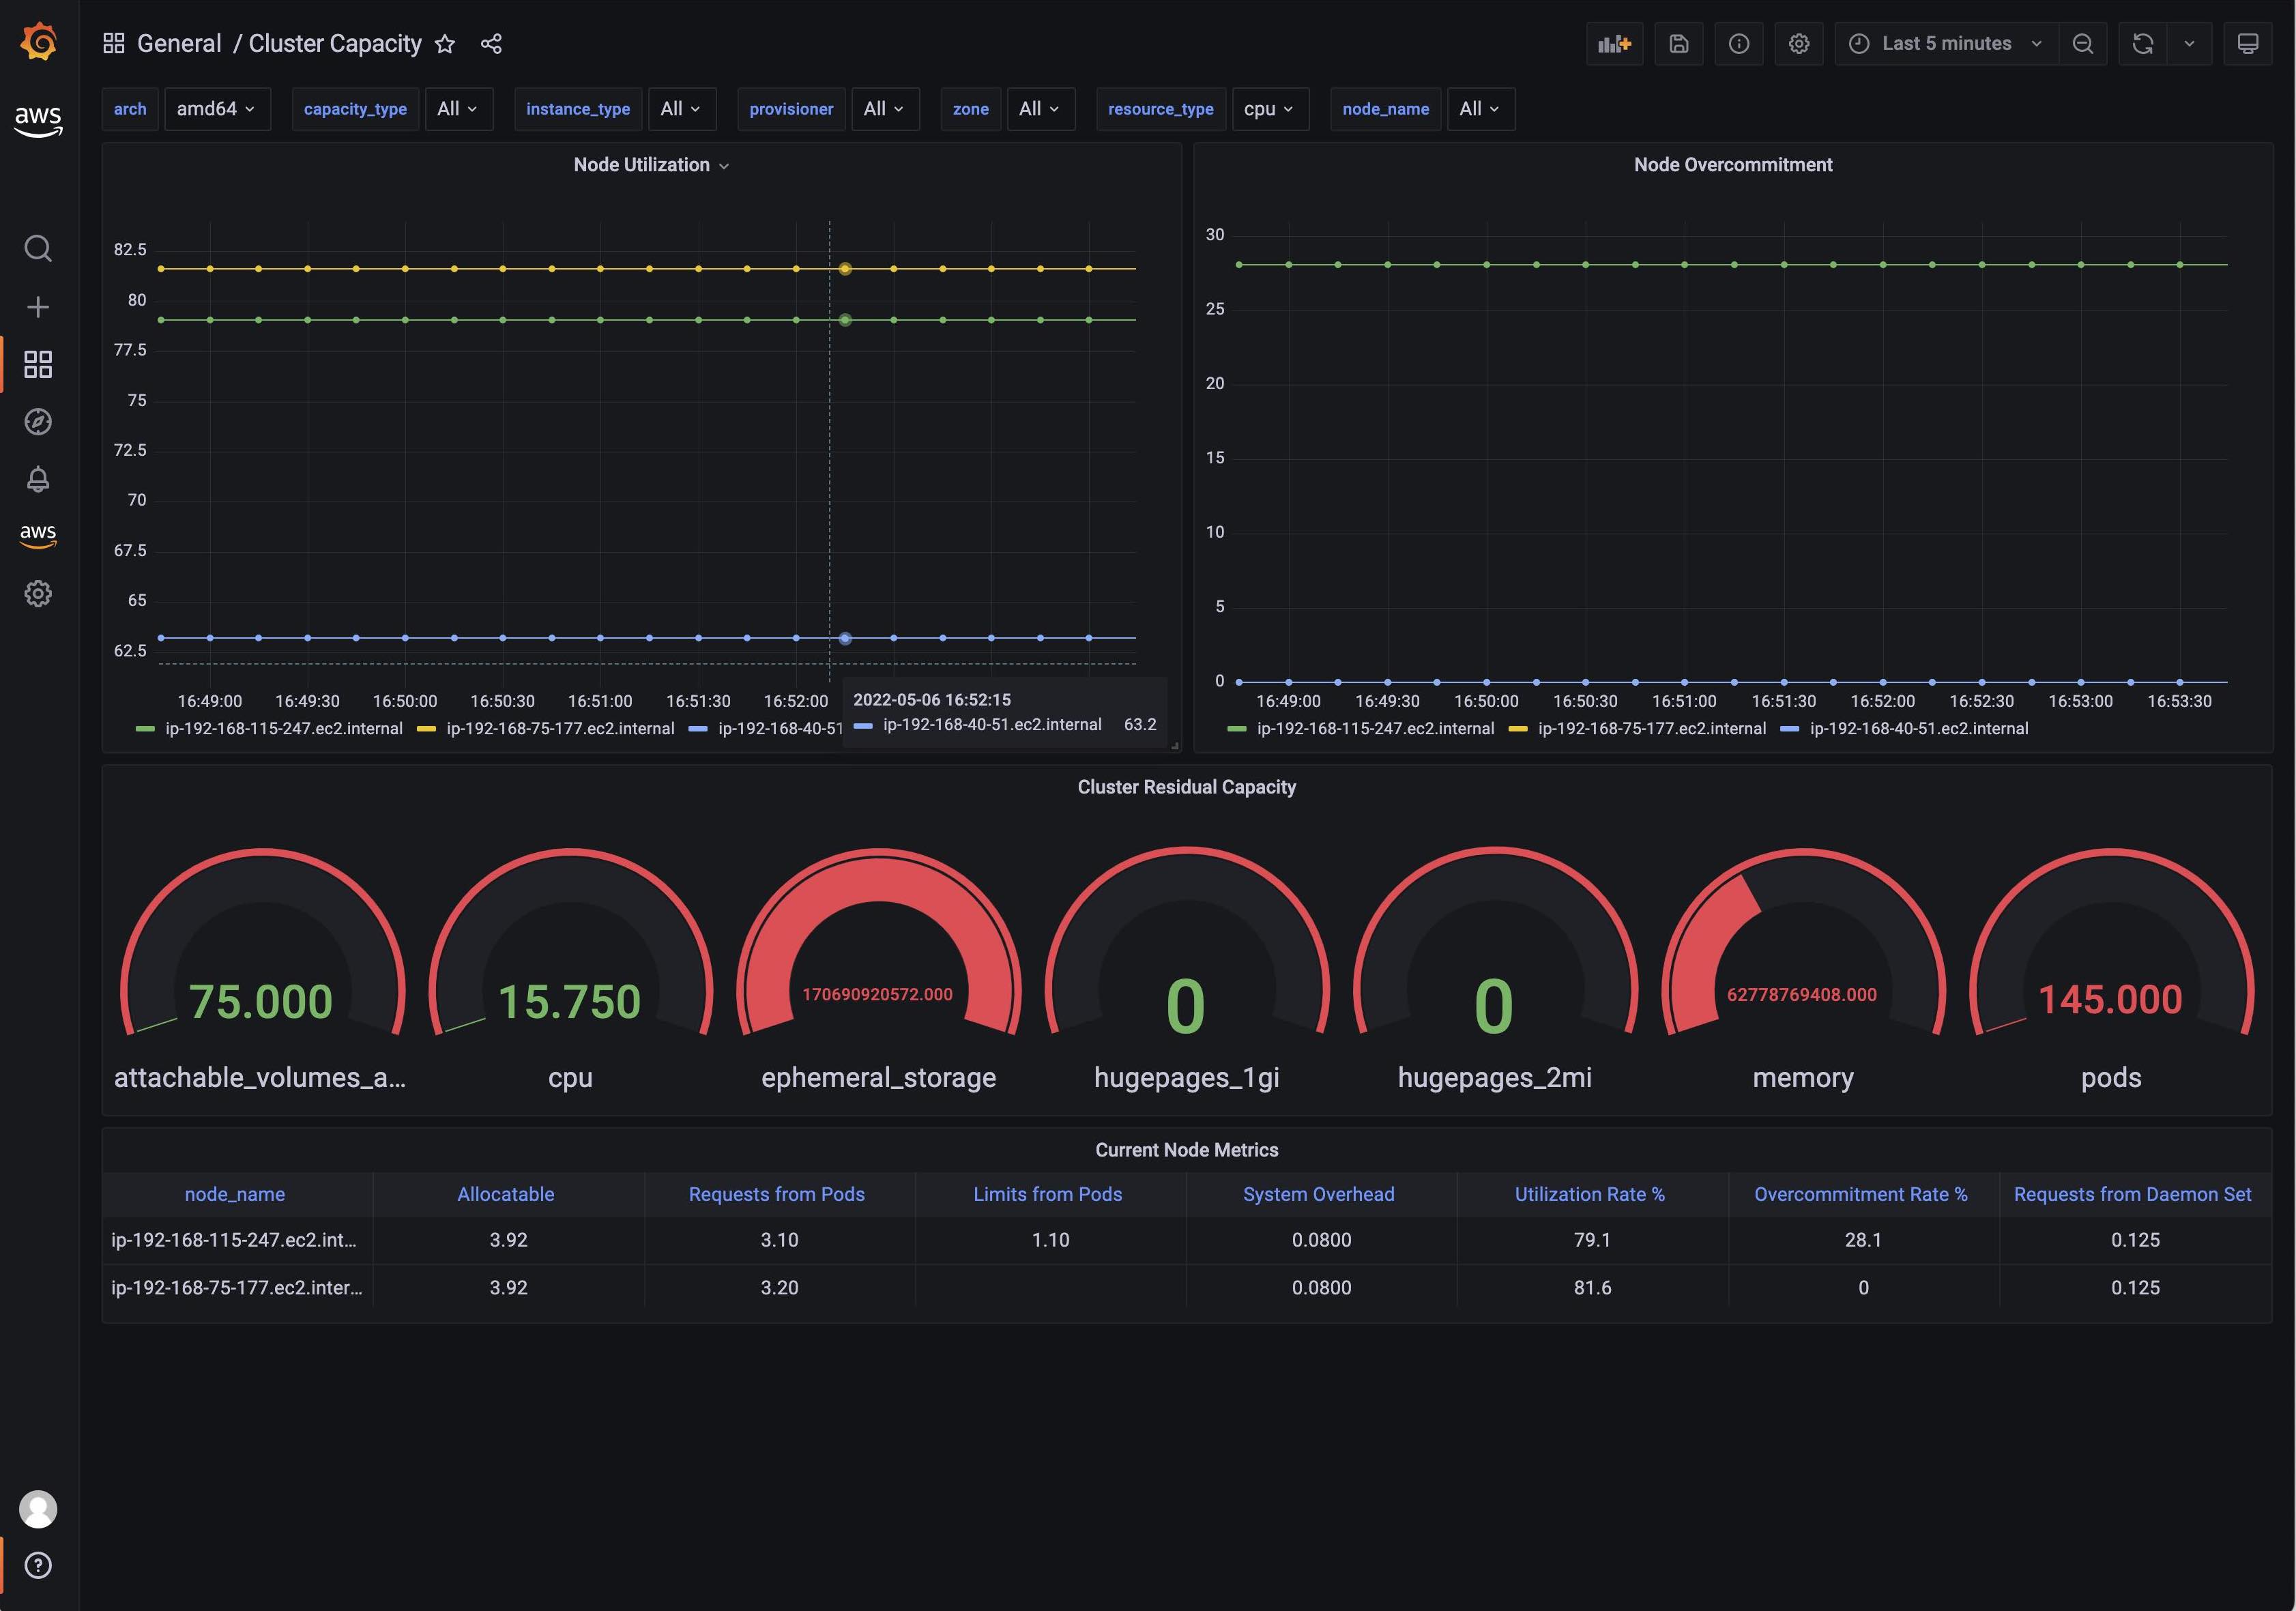
This dashboard monitors cluster capacity and efficiency across a Karpenter-managed environment, focusing on how resources are allocated and consumed by nodes and pods. It highlights node utilization, overcommitment, and residual capacity, using metrics such as karpenter_nodes_allocatable, karpenter_nodes_total_pod_requests, and karpenter_nodes_total_overhead to reveal how close the cluster is to its limits and where headroom exists for scheduling. The panels provide a real-time view of current node metrics, pod/daemon requests and limits, and overall resource pressure to support capacity planning and overcommitment decisions.
Screenshots
Used Metrics 99
karpenter_nodes_allocatable
karpenter_nodes_system_overhead
karpenter_nodes_total_daemon_limits
karpenter_nodes_total_daemon_requests
karpenter_nodes_total_overhead
karpenter_nodes_total_pod_limits
karpenter_nodes_total_pod_requests
karpenter_nodes_total_requests
karpenter_pods_state